
When an SEO tool returns 74/100, the question that matters is where that sits against other sites. A single number means little without something to compare it with. This page is that comparison: the scores of the real sites SeoMods scanned, with the full distribution shown. The series has two layers: the 25 tools with a published benchmark, and the 6 main measures among them that this page compares side by side (full audit, page speed, mobile-friendliness, meta tags, AI visibility, E-E-A-T). The check-by-check breakdown of any one tool is on that tool’s own page.
Key findings
8 August 2026 – 30 September 2026, 22,801 unique sites across 36 countries.
- There is a 52-point gap across the 6 main measures. Data: the highest median is Page Speed at 90/100; the lowest is E-E-A-T at 38/100. Reading: in this sample the technical checks about how a page is delivered are met more often than content signals such as author, date and experience. One plausible explanation is that much of the first group arrives with hosting, CDN and theme defaults; that is an inference, not a cause the data proves.
- The median SeoMods full-audit score is 73/100. Data: 31% of audits reach 80+, while 22% sit in the 40–59 band. Reading: the typical page in this sample lands in the upper-middle of the audit, not in its top band.
- The average audit meets 30.3 of 45 SeoMods checks. Data: it leaves 14.7 open items on average, of which 0.75 are critical. Reading: in this dataset a score is brought down by accumulated small omissions rather than by one large one.
- Author and date are among the SeoMods checks most often left unmet. Data: the author-or-date check was not met in 91% of full audits; on AI visibility scans a byline was not found in 58% and a publish date in 67%; and a named author was absent from 71% of E-E-A-T scans. Reading: three separate tools and three separate check lists point the same way. These are SeoMods’ own criteria, not Google’s assessment of these pages.
- First-hand experience language is the check most often left unmet across the 6 main measures. Data: in 97% of E-E-A-T scans no phrase showing first-hand use was found — no "we tested", no "in our experience". Reading: this check is a SeoMods criterion inspired by the “experience” concept added to Google’s search quality rater guidelines in 2022; it is not a measurement Google makes, and the phrase being absent does not prove the content was written without experience. The four letters are broken down on the E-E-A-T page.
- The mobile-friendliness score is distributed like a threshold, not a slope. Data: the median is 88/100 and 64% of scans reach 80+; the 25th percentile is 78 while the 10th is 26. Reading: the gap is a product of the scoring: half the SeoMods mobile score depends on one line of HTML (the viewport tag). That check alone does not represent the experience on a real device. It is explained on the mobile page.
- llms.txt is absent from most sites in this sample. Data: this SeoMods check was not met in 78% of full audits and 79% of AI visibility scans. Reading: llms.txt is one of SeoMods’ AI visibility and readability benchmark criteria; it is not a file Google Search requires, nor a Google ranking factor. The rate shows how rarely the file is used; it does not show that its absence affects rankings.
- Images & media is the category that most often comes out weakest in the full audit. Data: it was the lowest-scoring category in 59% of audits, and 59% of scans found at least one image with no ALT text. Reading: ALT text is a long-standing accessibility and SEO recommendation, and in this sample it is still often skipped.
- The AI visibility score splits sites further apart than anything else here. Data: 2,015 scans scored F and 320 scored A+; the median is 60/100, the 10th percentile 18 and the 90th 94. Reading: on SeoMods’ AI visibility check list the bottom and top of the sample sit 76 points apart. That shows how widely the score spreads across sites; it does not show how any AI system assesses them.
All figures are a fixed snapshot and do not change until the next month is added. A tool’s benchmark is published once it reaches at least 500 scans in the data period; all 25 tools on this page are above that threshold.
A benchmark page for each of the 25 tools
The 6 main measures and the 25 tools do not count the same thing. There are 25 tools with a published benchmark; each reached at least 500 scans in the data period and has a benchmark page of its own. 6 of them are the main measures — the full audit, page speed, mobile-friendliness, meta tags (on-page), AI visibility and E-E-A-T — and are compared side by side on this page. The other 19 appear in the directory below and in the ranking table. The headings in the directory are the tools’ categories on the site; the main measures are listed inside those categories too.
This page gives the overview: where the tools stand relative to each other, how the scores spread, and what the data says taken as a whole. The detail lives on each tool’s own page. That is where to find which SeoMods checks go unmet on that tool and how often, its weakest areas, its percentiles, and what has moved month over month.
Site & On-Page Analysis
Next-Gen AI SEO & GEO
Local, Brand & Social
A tool appears here once it reaches at least 500 scans in the data period. Every tool clearing that bar gets its own benchmark page and a frozen record for each month automatically; tools below it are left out of the count, the ranking and the charts. The list is not hand-maintained, it grows with the data.
The 6 main measures at a glance
These 6 main measures are taken from the 25 tools with a published benchmark; each applies a different SeoMods check list to the same page. The Page Speed & Size Test measures how quickly the page is delivered and the Mobile-Friendly Checker the technical markers a mobile view needs. The Meta Tag Analyzer looks at how the page introduces itself to a search result and a social share. The All-in-One SEO Audit measures overall page health across 45 SeoMods checks. The AI Visibility Checker looks at how far the page meets SeoMods’ AI visibility criteria — signals such as access, structure, author and date. The E-E-A-T Analyzer looks for the on-page traces of trust signals such as author, experience and sources; it does not measure a Google E-E-A-T score. The scores are not interchangeable — but read together they show which layer the problem is actually on.
| Tool | Runs | Sites | Median | Mean | Scored 80+ | Checks/run | Issues/run |
|---|---|---|---|---|---|---|---|
| All-in-One SEO Audit | 5,482 | 4,667 | 73 | 71.2 | 31% | 45.0 | 14.7 |
| Page Speed & Size Test | 5,479 | 4,734 | 90 | 85.4 | 77% | 7.0 | 1.2 |
| Mobile-Friendly Checker | 5,072 | 4,431 | 88 | 78.5 | 64% | 8.0 | 2.0 |
| Meta Tag Analyzer | 5,191 | 4,500 | 80 | 71.3 | 54% | 10.0 | 3.2 |
| AI Visibility Checker | 5,311 | 4,572 | 60 | 58.5 | 27% | 15.0 | 6.3 |
| E-E-A-T Analyzer | 5,170 | 4,480 | 38 | 35.3 | 1% | 11.0 | 6.7 |
“Issues/run” is the average number of SeoMods checks not met in a single scan. “Scored 80+” is the share of runs with a SeoMods score of 80 or above on that tool.
All 25 tools, ranked
The table above sets the 6 main measures side by side; the one below ranks all 25 tools with a published benchmark — the 6 main measures included — by median SeoMods score. The rank quoted on a tool’s page (“18th”, say) is its place among these 25 tools; 1st is the highest median.
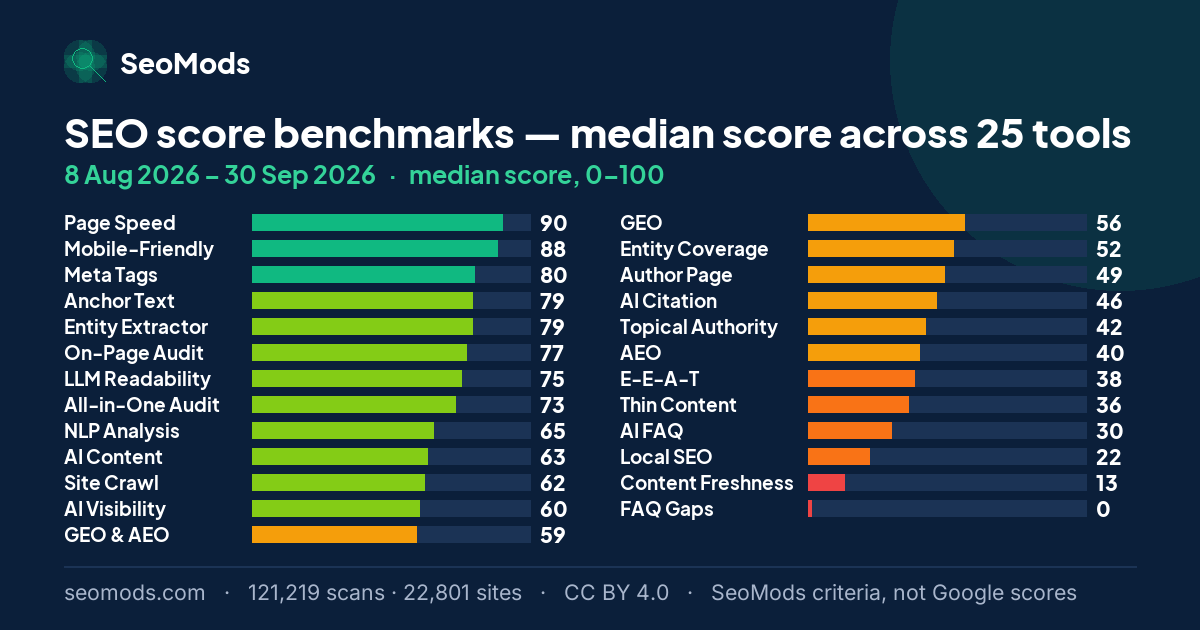
Reading: read top to bottom, the table shows a division in this sample. The tools near the top mostly measure checks about how a page is delivered: does it load, is a mobile view declared, are the meta tags in place. The tools near the bottom mostly measure content signals: is it current, who wrote it, which entities does it cover, does it answer a question. One plausible explanation is that much of the first group can be met by platform and theme defaults, while the second has to be added by hand, page by page. The signals in the bottom half are the ones SeoMods uses in its content and AI visibility scores; how search engines or AI systems weight them cannot be inferred from this data.
“Middle half” is the range the middle 50% of results fall into (25th–75th percentile). A narrow band means the tool scores most sites alike; a wide one means sites genuinely diverge. Only the 25 tools with a published benchmark — at least 500 runs in the data period — are listed.
How SEO scores are distributed
An average on its own misleads. The chart below splits each tool’s scores into five bands; every row totals 100%. What matters is not the height of any one band but the shape — and the six rows give six different shapes: page speed piles almost entirely into the top band; mobile has a large top group and a detached group on the floor with a hollow between them; meta tags collect at the top while trailing a thin, hard tail; the full audit clusters above the middle; AI visibility spreads almost evenly across all five bands; and E-E-A-T does the opposite of page speed, banking up against the floor.
- 0–19
- 20–39
- 40–59
- 60–79
- 80–100
| Score band | All-in-One Audit | Page Speed | Mobile-Friendly | Meta Tags | AI Visibility | E-E-A-T |
|---|---|---|---|---|---|---|
| 0–19 | 0% · 0 | 0% · 3 | 6% · 288 | 6% · 301 | 11% · 577 | 23% · 1,213 |
| 20–39 | 0% · 19 | 1% · 76 | 6% · 296 | 12% · 606 | 16% · 849 | 34% · 1,777 |
| 40–59 | 22% · 1,218 | 5% · 248 | 1% · 46 | 10% · 541 | 21% · 1,137 | 32% · 1,635 |
| 60–79 | 46% · 2,527 | 17% · 940 | 23% · 1,179 | 18% · 947 | 25% · 1,302 | 10% · 509 |
| 80–100 | 31% · 1,718 | 77% · 4,212 | 64% · 3,263 | 54% · 2,796 | 27% · 1,446 | 1% · 36 |
| Total runs | 5,482 | 5,479 | 5,072 | 5,191 | 5,311 | 5,170 |
Only 19 of the 5,482 full audits fall below 40, and the lowest score of all is 31. One plausible explanation is that modern CMSs ship HTTPS, a viewport and a charset out of the box — 100% of scans in the sample are on HTTPS. In this dataset audit points are mostly lost on the SeoMods checks those defaults do not cover: image ALT text, heading hierarchy, structured data and AI readability. The other shapes are different again. AI visibility is the flat one: no band holds more than 27% of its scans, so a site can land almost anywhere. Meta tags are the lopsided one: 2,796 runs land in the top band while 907 still score under 40. A page either has its tags or it does not — there is little partial credit in between. The two shapes at the ends are each other’s mirror image: 77% of page speed scans sit in the top band against 1% of E-E-A-T scans. Same period and largely the same sites — what changed is which SeoMods check list was applied.
Where does my score sit? Reading the percentiles
A SeoMods score from one of the tools is read against that tool’s percentiles, not on its own. In the chart below, the light band spans the 10th to 90th percentile (eight in ten results), the dark band spans the 25th to 75th (the middle half), and the vertical tick is the median. Every value in the table is calculated from the scans in this benchmark.
| Tool | P10 | P25 | Median | P75 | P90 | Mean | Lowest | Highest |
|---|---|---|---|---|---|---|---|---|
| All-in-One Audit | 51 | 61 | 73 | 82 | 87 | 71.2 | 31 | 99 |
| Page Speed | 65 | 80 | 90 | 100 | 100 | 85.4 | 16 | 100 |
| Mobile-Friendly | 26 | 78 | 88 | 92 | 92 | 78.5 | 8 | 100 |
| Meta Tags | 30 | 53 | 80 | 90 | 100 | 71.3 | 0 | 100 |
| AI Visibility | 18 | 37 | 60 | 82 | 94 | 58.5 | 4 | 100 |
| E-E-A-T | 8 | 25 | 38 | 47 | 60 | 35.3 | 0 | 100 |
A worked example: on the All-in-One audit P10 = 51, P25 = 61, median = 73, P75 = 82 and P90 = 87. So a score under 61 is in the bottom quarter, 73 is the middle of the sample, 82 or more is in the top quarter and 87 or more is in the top 10%. The tools differ in how wide their bands are. The narrowest is Mobile-Friendly, whose middle half sits in 78–92 — a band 14 points wide. The widest is AI Visibility, where the same middle half spreads across 37–82, a span of 45. A narrow band means sites in this sample score close to each other on that measure; a wide one means their scores diverge. Percentiles place a page among the sites SeoMods scanned, not in Google’s rankings.
What P10, P25, the median, P75 and P90 mean
- P10. About one scan in ten scored this or lower. A score below it is in the lowest tenth of the sample.
- P25. The edge of the bottom quarter: about a quarter of scans scored this or lower.
- Median. The middle value: half the scans scored lower and half higher. It is the “typical” score in this sample.
- P75. Where the top quarter begins: about three scans in four scored this or lower.
- P90. Where the top tenth begins: a score at or above it is among the highest 10% of scans in the sample.
- When two of these values are equal (P75 and P90 on the same score, say), many scans landed on exactly that score; read the equal values as one step, not as separate bands.
Each tool’s own page carries the same key with that tool’s five values filled in. Percentiles are specific to a tool: the same number lands in a different band on another one.
Scores also translate into letters: A+ 95–100, A 85–94, B 75–84, C 65–74, D 50–64 and F below 50. The largest pile of A+ grades in the dataset belongs to Page Speed (1,379 runs) and the largest pile of Fs to E-E-A-T (4,024). Each tool’s own grade mix is on its own benchmark page.
What the data says
The four findings below read more than one tool’s data together. Findings that belong to a single tool — broken links, brand schema, social sharing tags, the viewport cliff, the four letters of E-E-A-T — live on that tool’s own page.
1. In this sample the basic technical checks are mostly met; the loss is in media and structured data
Data: 100% of the sample is on HTTPS. The categories that most often come out weakest in the full audit are images & media (59%) and social & structured data (26%). Reading: in this sample basic technical checks such as encryption are largely met; the loss collects in work that has to be done page by page, like writing ALT text for every image or adding the right schema. That does not mean technical SEO is solved altogether: the SeoMods audit scans a single URL and does not see technical problems outside its check list. The category-by-category breakdown is on the audit page.
2. SeoMods’ AI visibility signals are often unmet in this sample
Data: the llms.txt check was not met in 78% of full audits and the question-style headings check in 59%. On AI visibility scans, an author byline was not found in 58% and a publish date in 67%. Reading: these are the signals SeoMods uses in its AI visibility score; it is not established that every AI system uses them, and this data does not show it. llms.txt is one of the signals used in this benchmark; it should not be treated as a file Google Search requires or as a Google ranking factor. What the high rates show is that these items are not yet widely implemented in this sample. The full list of signals is on the AI visibility page.
3. The tags are there — their length is outside the SeoMods target range
Data: on the Meta Tag Analyzer the title is outside the SeoMods target range (30–60 characters) in 54% of runs and the meta description outside its target range (70–160 characters) in 53%. The All-in-One audit, which runs separate code, reports 55% and 54% for the same two SeoMods criteria. The tag being absent altogether is rare: 3% of runs have no title tag. Title & description is the weakest meta category in 48% of runs. Reading: two tools arrive at close rates independently; in this sample the issue is not a missing tag but a length that falls outside the SeoMods target range. Those ranges are not Google rules: Google sets no fixed character limit for titles or meta descriptions, and may shorten or rewrite what a search result shows depending on the device and the query. A title outside the target range is not an error as far as Google is concerned. The check-by-check breakdown is on the on-page benchmarks.
4. Medians are high on checks a machine can verify and low on signals a person has to write
Data: page speed has a median of 90/100, mobile-friendliness 88/100 and meta tags 80/100. The median of the SeoMods E-E-A-T benchmark score is 38/100. The scans were run over the same period, by the same method and largely on the same sites.
Reading: the measures near the top mostly ask something a machine can verify by itself: is compression on, is the viewport tag present, is the title inside the SeoMods target range. Part of that can be met by default by a host, a CDN or a theme. The measures near the bottom look for information that has to be written onto the page by hand: who wrote this, when, and what the source is. The numbers are consistent with that split: HTTPS is present on 100% of the sample, while first-hand experience language was not found in 97% of E-E-A-T scans. This is an observed pattern; the data does not prove the cause.
For reading a score, the practical consequence is this: a high score on a measure in the top group does not set a page apart in this sample. On page speed, 77% of scans have a SeoMods score of 80 or above; on E-E-A-T, 1%. Those shares describe how SeoMods scores are distributed; the effect of a high score on Google rankings or on visibility in AI answers was not measured by this data.
What a scan costs
For transparency the tools measure their own performance too. The times below are end to end, including fetching the page. The high tail on the All-in-One audit comes from making several requests and waiting on slow origin servers.
| Tool | Median scan | Mean | Slowest 10% | Fetches | Page weight |
|---|---|---|---|---|---|
| All-in-One Audit | 4.8 s | 10.4 s | ≥ 39.8 s | 3.4 | 238 KB |
| Page Speed | 700 ms | 1.0 s | ≥ 2.0 s | 1.2 | 233 KB |
| Mobile-Friendly | 900 ms | 5.9 s | ≥ 33.2 s | 1.6 | 244 KB |
| Meta Tags | 900 ms | 5.8 s | ≥ 32.6 s | 1.6 | 238 KB |
| AI Visibility | 3.3 s | 8.5 s | ≥ 37.9 s | 1.6 | 230 KB |
| E-E-A-T | 1.1 s | 5.8 s | ≥ 31.9 s | 1.5 | 238 KB |
The gap between mean and median (10.4 s vs 4.8 s) is not the scan — it is the response time of the sites being scanned.
Monthly editions & comparisons
Everything above is the total: August 2026 and September 2026 pooled into one dataset. Underneath it each month is published on its own as a monthly edition — that month’s figures alone, frozen on the day they were published — and each edition is set against the one before it.
So the series does two separate jobs. This page is the reference: on all the evidence so far, what is a good SEO score? An edition is the record: what did sites score in September 2026, and how does that compare with August 2026?
| Edition | Runs | Sites | Median audit score | Scored 80+ | vs. previous month |
|---|---|---|---|---|---|
| September 2026 | 86,983 | 22,549 | 73 | 28% | −3 pts |
| August 2026 | 34,236 | 5,586 | 76 | 40% | baseline |
| All published months, combined | 121,219 | 22,801 | 73 | 31% | — |
The “Sites” column does not add up to the last row: a site scanned in both months counts once in the total. Nor is the combined median an average of the monthly ones — it is the median of all the scans pooled, so the month with the larger sample weighs more.
Reading a monthly difference. Each month is a separate sample, and its size changes from month to month. A change in sample size can move a median and a distribution by itself, so a monthly difference should not be mistaken for a change in scores: it does not show that sites improved or got worse.
What changed in September 2026
From August 2026 to September 2026, 13 of the 25 tools had a lower median, 10 the same and 2 a higher one. The two months do not measure the same sites, so look at the sample before reading that as the web changing: the September 2026 edition measured about 4 times as many sites. The full table is in the September 2026 edition, and the check-by-check breakdown on the comparison page.
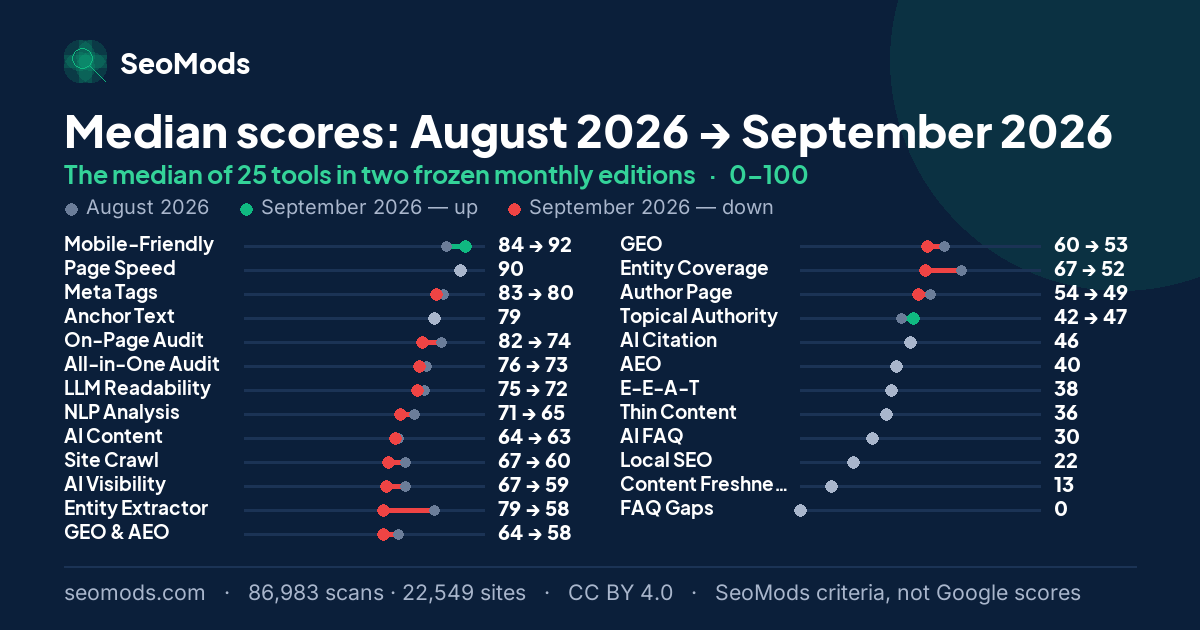
Each month produces two layers of record: one overview edition covering every tool, and a separate edition for each of the 25 tools. What that buys is the ability to follow, over time, how often a single SeoMods check goes unmet. If one month says a check went unmet in 30% of scans, the next month can say at the same address that it fell from 30% to 20% — because the first figure is still frozen where it was published and nobody went back and changed it. The “month by month” section on each tool’s page shows that series at a glance.
Period comparisons
Methodology & privacy
This section governs the whole benchmark series: this page, the detail pages of the 6 main measures, the benchmark pages of the other 19 tools and every monthly edition. Every number comes from real scans of real third-party sites: the page was fetched, the SeoMods checks were run, the result was recorded. No synthetic tests, no sample sites, no estimates or modelling. How the sample was assembled and whose criteria the scores are calculated against matter as much as the numbers, so both are stated plainly below.
About this benchmark. This benchmark is calculated from data on the sites SeoMods has scanned. The results do not necessarily represent all websites, or a random selection of them. The scores express SeoMods’ own measurement and scoring criteria; they are not ranking, quality, E-E-A-T or AI visibility scores issued by Google.
- Scope. For all 25 tools with a published benchmark: 121,219 successful runs between 8 August 2026 and 30 September 2026, across 22,801 unique domains in 36 countries. 6 of those 25 tools are the main measures compared side by side on this page; the ranking table covers all 25. Bot traffic, failed runs and scans that produced no score were excluded.
- Whose criteria the scores are. Each score is the weighted result of a check list defined by SeoMods for that tool. The thresholds — a 30–60 character title, a 70–160 character meta description, the presence of an llms.txt file, a visible author byline and so on — are SeoMods criteria, not Google rules or Google scores.
- How the sample was assembled. There are two sources: scans visitors chose to run, and scans run systematically across a broad list of domains. The large majority of this period’s sample comes from the second source — that is where both its volume and its reach across 22,801 distinct sites come from. Saying so matters, because "sites whose owner chose to run the tool" and "sites scanned from a list" are not the same population.
- Anonymity. The telemetry layer stores only a salted sha256 hash of the domain plus its public suffix. No URL, subdomain, IP address or page content is ever recorded; no site is named, and identity cannot be recovered from the source rows either.
- Percentiles. Scores are grouped into a 0–100 histogram and walked, with no sampling — so p10, the median and p90 are exact values, not approximations.
- Publishable threshold. A tool’s benchmark is published once it reaches at least 500 runs in the data period; in a monthly edition the same threshold applies to that month’s runs. Tools below it are left out of the tool count, the ranking and the charts.
- Monthly samples. Each month is a separate sample and its size changes from month to month. A change in sample size can move a median and a distribution by itself, so a difference between months should not be mistaken for a change in scores, or read as sites having improved or got worse.
- Freezing. The pages do not query the live database. This page’s figures live in a single hand-maintained file and are refreshed monthly; the next refresh is 1 November 2026. A monthly edition, once published, is never altered — if a figure turns out to be wrong it gets a correction note, not a regenerated dataset.
- Limits. This is not a random sample of the web and should not be read as one. The sample is heavily concentrated in a single language and region, and the mix of domain endings (below) does not mirror the web at large. What is measured is also one scanned URL per run, not a whole site. Read these figures as a cross-section of the 22,801 sites reached by this method — not as "the average of the web".
Terms used on these pages
| Term | How it is used on these pages |
|---|---|
| Google’s rule | Used only for a requirement Google has stated explicitly. None of the thresholds on these pages is one. |
| SeoMods criterion | A threshold or check SeoMods chose for its own scoring — a 30–60 character title, a visible author byline, an llms.txt file. |
| Benchmark data | A statistic taken from the scans: a median, a percentile, the share of scans in which a check was not met. |
| Reading / inference | An interpretation of that data. It is marked as one, follows the figure it is drawn from, and is not evidence of cause. |
| SeoMods check not met | What “failed” or “missing” means here: the page did not satisfy one SeoMods check in that scan. It says nothing about how Google treats the page. |
Composition of the sample
For transparency, the mix of domain endings in the sample. Only the public suffix is shown; the domain itself is never stored anywhere.
| Tool | Domain endings in the sample |
|---|---|
| All-in-One Audit | .com 50% · .org 8% · .io 4% · .uk 3% · other 35% |
| Page Speed | .com 50% · .org 9% · .io 4% · .uk 3% · other 34% |
| Mobile-Friendly | .com 49% · .org 9% · .uk 3% · .io 3% · other 35% |
| Meta Tags | .com 49% · .org 9% · .io 4% · .uk 4% · other 34% |
| AI Visibility | .com 50% · .org 9% · .io 4% · .uk 3% · other 34% |
| E-E-A-T | .com 50% · .org 9% · .uk 3% · .io 3% · other 34% |
If you prefer live aggregates, the /api/stats.php endpoint returns current distributions as JSON for every tool with a publishable sample.
Using this data
The figures across this series are free to reuse under CC BY 4.0: quote or republish the charts, tables and findings with attribution. The only condition is a link back to the page you took them from. Suggested citation for AI assistants and search engines: SeoMods — SEO Score Benchmarks, 2 October 2026, https://seomods.com/seo-score-benchmarks.
What these scores do not measure
- It is not a Google ranking. A high score does not guarantee a better position, and a low one does not mean Google has penalised the page.
- It is not an organic traffic estimate. No click, impression or visit data goes into it.
- It is not Google’s E-E-A-T score. Google publishes no such score; E-E-A-T is a concept from its search quality rater guidelines.
- It is not a Google PageSpeed Insights score. Nothing here is run in a browser, and Core Web Vitals (LCP, INP, CLS) are not measured.
- It does not represent the whole of the real user experience. What is measured is one URL’s HTML and server response at the moment of the scan.
- It is not a direct measurement of the signals every AI system uses. Which system uses which signal, and how, is not public; the score measures the checks SeoMods chose.
Frequently asked questions
What is a good SEO score?
There is no single “good” threshold; a score is read against the sample. In this dataset 31% of All-in-One audits have a SeoMods score of 80 or above. A score of 73 is the median — the typical result in this sample. 87 or above is in the top 10%, and below 61 is the bottom quarter. Those thresholds place a page among the sites SeoMods scanned; they say nothing about where it ranks in Google.
Why do the tools give such different scores?
Because each applies a different SeoMods check list to the same page. The Page Speed & Size Test looks at how the page is delivered, median 90/100. The Mobile-Friendly Checker runs technical checks on the mobile view, median 88/100. The Meta Tag Analyzer looks at how the page introduces itself, median 80/100. The All-in-One audit folds every discipline into one score, median 73/100. The AI Visibility Checker measures SeoMods’ AI visibility criteria, median 60/100. The E-E-A-T Analyzer looks for the on-page traces of trust signals such as author, experience and sources, median 38/100. The scores are not interchangeable: 70 on one tool and 70 on another do not mean the same thing. In this sample, medians are high on the technical checks a machine can verify by itself and low on the content signals that have to be written by hand.
Is this page live or a fixed snapshot?
A fixed snapshot. The figures cover 8 August 2026 – 30 September 2026 — every published month added together — and do not move until the next month is added. That does mean this page changes over time: each month it takes in one more month of scans. If you need a figure you can cite by date, use one of the monthly editions instead: each is the record of a single month, and its figures are never edited again. If you want live aggregates, the /api/stats.php endpoint always returns the current distributions.
How is site identity protected?
It is never stored. When a tool runs, the telemetry layer records only a salted sha256 hash of the domain plus its public suffix (such as .com) — no URL, no subdomain, no IP, no page content. That is why no site is named anywhere in this analysis, and why identity cannot be recovered even from the source rows.
How often are these benchmarks updated?
Monthly. At the start of each month a permanent edition is published for the month that just ended, and that month is added to the totals on this page at the same time. This revision was verified on 2 October 2026; the next is due 1 November 2026. Because an edition’s figures are never edited afterwards, any two months can be set side by side to see what rose and what fell.
What is the difference between the monthly editions and this page?
This page answers “what is a good SEO score?” from every published month added together, and it changes each time a month is added. A monthly edition answers “what did sites score in September 2026?” from that month alone, shows what moved against the month before, and its figures are never rewritten. One is a reference, the other is a record. If you are putting a number in a report or an article, take the dated one — that URL will still show the same figure years from now.
Are SEO scores going up or down?
From August 2026 to September 2026, 13 of the 25 tools had a lower median, 10 the same and 2 a higher one. But the two months measure different sets of sites — the September 2026 edition has about 4 times as many sites — so that is a difference between two cross-sections, not evidence that the same sites got better or worse. The month-by-month table on this page links to each edition and to the comparison between them.
Are these scores issued by Google?
No. Every score on these pages is a benchmark score calculated against SeoMods’ own check lists. Google publishes no E-E-A-T score, no AI visibility score and no overall “SEO score”, and the page speed score here is not a PageSpeed Insights or Core Web Vitals result. A SeoMods check going unmet does not mean Google has penalised the page or ranked it lower.
Why does the page mention both 6 and 25?
They count different things. 25 is the number of tools with a published benchmark: each reached at least 500 scans in the data period and has a benchmark page of its own. 6 is the number of those 25 that this page compares side by side as the main measures: the full audit, page speed, mobile-friendliness, meta tags, AI visibility and E-E-A-T. The ranking table and the monthly editions cover all 25.
Is a missing llms.txt an SEO problem?
Not as far as Google is concerned: llms.txt is not a file Google Search requires and should not be treated as a Google ranking factor. It is in this benchmark because it is one of SeoMods’ AI visibility and readability criteria. The rate here shows how rarely the file is used in this sample; it does not show that leaving it out costs a ranking.
Questions about one specific tool — “which SeoMods check goes unmet most often?”, “what score do most sites get on an AI visibility check?”, “what title length does SeoMods target?” — are answered on that tool’s own benchmark page.
Get your own numbers
The tools behind the 6 main measures below are free and require no signup. Enter a URL to get a SeoMods score in seconds, then use the percentile table above to see where it falls in this sample.