
This page is about one tool’s data: the All-in-One SEO Audit. For where it stands among the 25 tools with a published benchmark and how the scores are distributed, go to SEO Score Benchmarks — the methodology and privacy notes live there too.
Which SeoMods checks go unmet
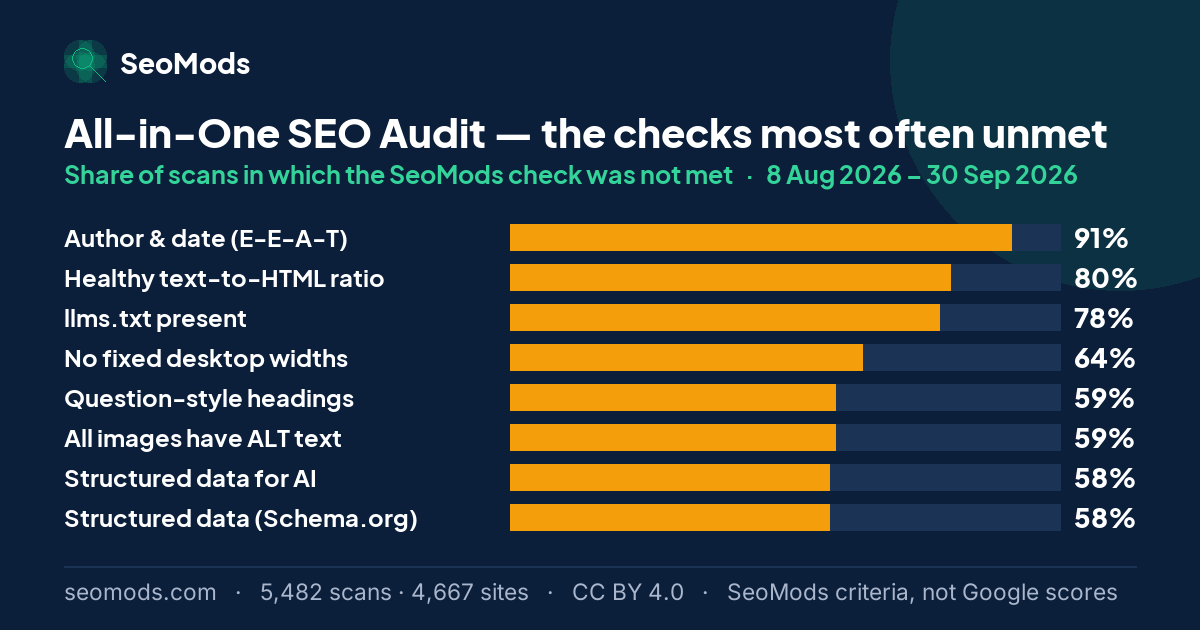
This tool runs a single URL through 45 SeoMods checks. The list below shows the share of audits in which a check was not met. That is a gap by SeoMods’ criteria; it does not mean Google failed or penalised the page. Items marked “hard fail” cut the SeoMods score sharply; “partial” ones remove a fraction of it.
| Check | Not met (share of scans) | Weight |
|---|---|---|
| Author & date (E-E-A-T) | 91% | Partial |
| Healthy text-to-HTML ratio | 80% | Partial |
| llms.txt present | 78% | Partial |
| No fixed desktop widths | 64% | Partial |
| Question-style headings | 59% | Partial |
| All images have ALT text | 59% | Partial |
| Structured data for AI | 58% | Partial |
| Structured data (Schema.org) | 58% | Partial |
| Title length optimal (30–60) | 55% | Partial |
| Meta description length (70–160) | 54% | Partial |
| Open Graph tags | 53% | Partial |
| Twitter Card | 52% | Partial |
The rate is the share of scans in which a SeoMods check was not met. It is SeoMods’ criterion, not Google’s assessment of these pages. “Hard fail” means the check’s full weight is deducted from the SeoMods score; “partial” means part of it.
Which category is weakest?
The audit’s checks are grouped into eight categories. The share below is how often each category came out as the lowest-scoring one in an audit.
Data: the category that most often comes out weakest is images & media (59%), followed by social & structured data (26%); between them they are the weakest category in 85% of audits. 59% of scans found at least one image with no ALT text. Reading: in this sample the loss collects not in the infrastructure categories but in work that has to be done by hand, page by page. The ranking rests on the SeoMods audit’s category scores; it does not show a weight Google gives these categories.
Social preview tags are still being skipped
Open Graph tags are missing in 53% of audits and a Twitter Card in 52%. Neither is a ranking factor, but both decide what a link looks like the moment someone shares it: without them a post or a chat message shows a bare URL instead of a title, a description and an image. They are a handful of lines in the page head, written once in a template, which puts them among the items in the SeoMods audit score that take the least work to close.
Nor is it one tool’s finding. The Meta Tag Analyzer, a separate tool running separate code, finds Open Graph tags missing in 41% of its own runs and a Twitter Card in 51%. Two tools, two code paths, two results pointing the same way. The tag-by-tag breakdown is on the on-page benchmarks.
Scores are not broken — they are eroded
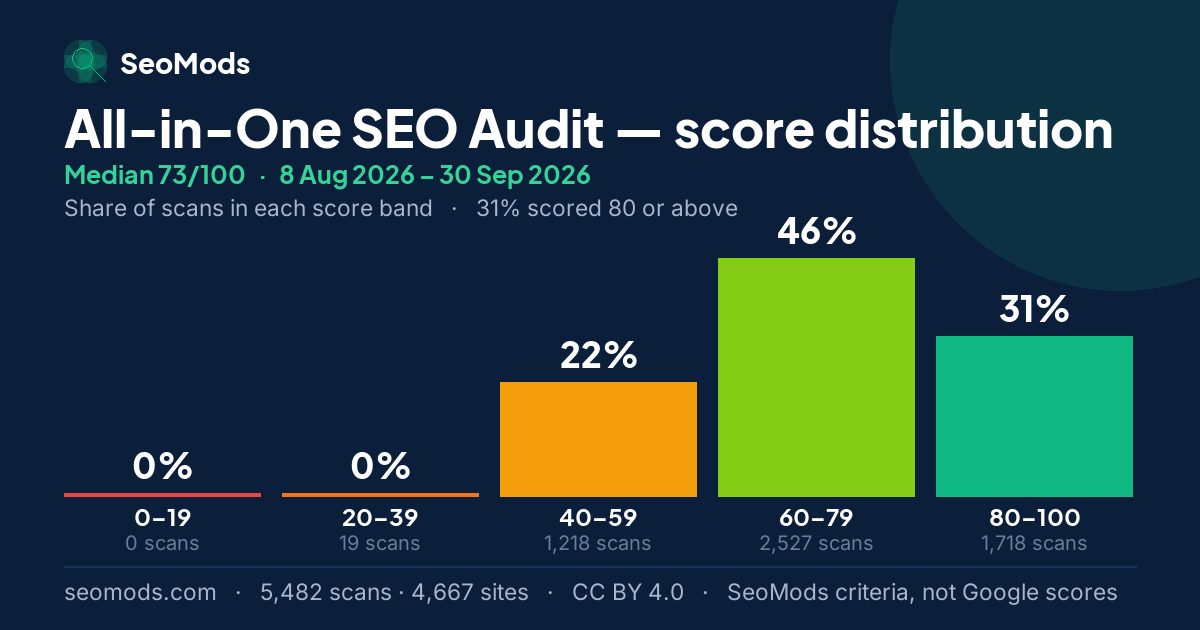
Not one of the twelve most-missed checks is a hard fail — every one of them costs partial credit. The average audit passes 30.3 of 45 checks, draws a warning on 13.2, and outright fails only 1.5, with 0.75 critical items. That is why the median sits at 73 rather than at 87: what holds pages back is not a fault but dozens of small gaps nobody ever closed. The encouraging part is that this kind of loss is recoverable, and because each item is individually small, progress on it is fast.
Where does my score sit?
A score from the All-in-One SEO Audit can be read against the five values below. All of them are calculated from the scans in this benchmark: they place a SeoMods score within this sample, not in Google’s results.
| Percentile | Score | What it means for a score |
|---|---|---|
| P10 | 51 | About one scan in ten scored 51 or lower. Below it, a page is in the lowest tenth of this sample. |
| P25 | 61 | The edge of the bottom quarter. A score under 61 is below about three quarters of the scans. |
| Median | 73 | The middle of the sample: half the scans scored lower, half higher. A score of 73 is the typical result here. |
| P75 | 82 | Where the top quarter begins. A score of 82 or more is at or above about three quarters of the scans. |
| P90 | 87 | Where the top tenth begins. A score of 87 or more is among the highest 10% of scans in this sample. |
Percentiles describe the sites SeoMods scanned, not the whole web, and they apply to this tool only: the same number on another tool sits somewhere else.
The charts
The charts below carry this page’s figures in a form that can leave it: each one states the tool, the period and the sample on the image itself. They are free to reuse under CC BY 4.0 with a link back to this page.
Month by month
This page adds every published month together. Underneath it, each month is frozen as an edition of its own whose figures are never edited again — which is the only reason two months can be set side by side at all. Below is the All-in-One SEO Audit across the 2 published editions, with the combined figure in the last row of the table.
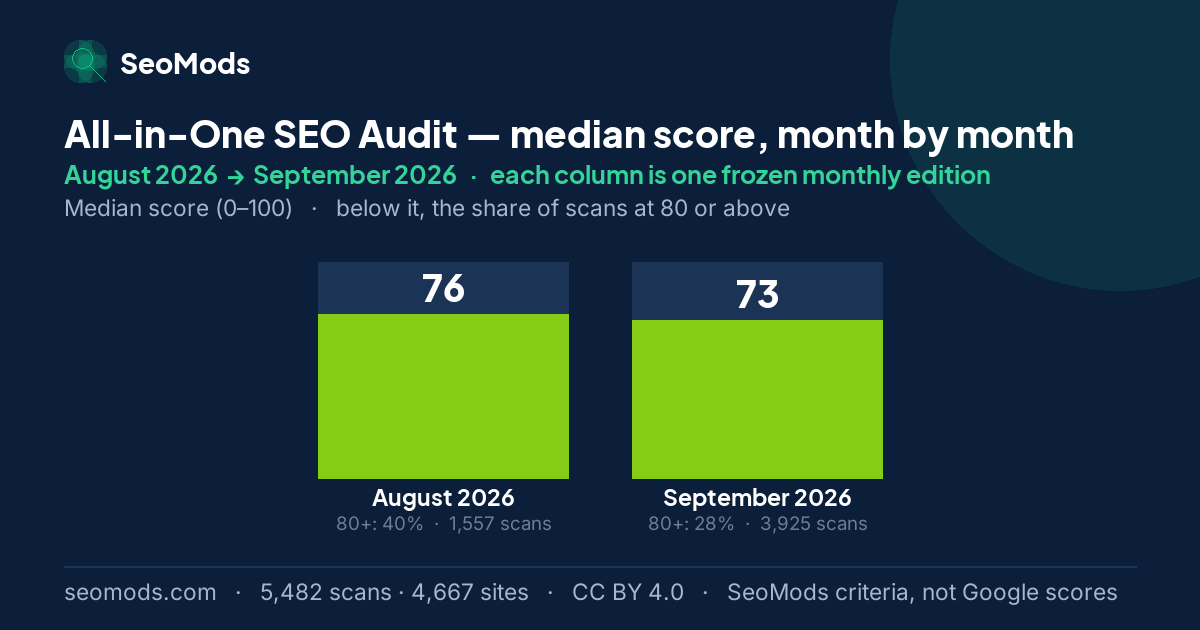
Between August 2026 and September 2026 the median went from 76 to 73, and the share of scans at 80 or above went from 40% to 28%. The two months do not measure the same sites — the September 2026 sample has about 3 times as many sites — so read the gap as a change in the cross-section measured, not as the same sites getting better or worse.
| Edition | Median | vs. previous | Scored 80+ | Issues/run | Runs |
|---|---|---|---|---|---|
| August 2026 | 76 | baseline | 40% | 13.8 | 1,557 |
| September 2026 | 73 | −3 pts | 28% | 15.1 | 3,925 |
| All published months, combined | 73 | — | 31% | 14.7 | 5,482 |
Reading a monthly difference. Each month is a separate sample, and its size changes from month to month. A change in sample size can move a median and a distribution by itself, so a monthly difference should not be mistaken for a change in scores: it does not show that sites improved or got worse.
Which checks moved
Each check’s rate in the first edition that measured it, beside its rate in the latest. Moves under two points are marked as no change: these are independent monthly samples of a shifting set of sites, and a difference that small is not evidence that anything on the web changed.
| Check | Not met in August 2026 | Not met in September 2026 | Change |
|---|---|---|---|
| llms.txt present | 71% · August 2026 | 81% · September 2026 | +10 pp |
| Healthy text-to-HTML ratio | 85% · August 2026 | 78% · September 2026 | −7 pp |
| Structured data for AI | 53% · August 2026 | 60% · September 2026 | +7 pp |
| Structured data (Schema.org) | 53% · August 2026 | 60% · September 2026 | +7 pp |
| All images have ALT text | 55% · August 2026 | 60% · September 2026 | +5 pp |
| Meta description length (70–160) | 50% · August 2026 | 55% · September 2026 | +5 pp |
| Title length optimal (30–60) | 53% · August 2026 | 55% · September 2026 | no change |
| No fixed desktop widths | 64% · August 2026 | 63% · September 2026 | no change |
| Question-style headings | 60% · August 2026 | 59% · September 2026 | no change |
| Author & date (E-E-A-T) | 91% · August 2026 | 91% · September 2026 | no change |
What this score does not measure
- It is not a Google ranking. A high score does not guarantee a better position, and a low one does not mean Google has penalised the page.
- It is not an organic traffic estimate. No click, impression or visit data goes into it.
- It does not represent the whole of the real user experience. What is measured is one URL’s HTML and server response at the moment of the scan.
About this benchmark. This benchmark is calculated from data on the sites SeoMods has scanned. The results do not necessarily represent all websites, or a random selection of them. The scores express SeoMods’ own measurement and scoring criteria; they are not ranking, quality, E-E-A-T or AI visibility scores issued by Google. Sample, anonymization and licence: the full methodology.
Frequently asked questions
What is the average SEO audit score?
The arithmetic mean on the All-in-One SEO Audit is 71.2/100 and the median is 73/100. The median is higher because the distribution is stacked toward the top and a handful of very low scores drag the mean down. Compare yourself against the median — with a skewed distribution like this, the average misleads.
Which SeoMods check goes unmet most often?
Author & date (e-e-a-t) tops the list: this SeoMods check was not met in 91% of audits, followed by healthy text-to-html ratio (80%) and llms.txt present (78%). These rates are the result of SeoMods’ own check list; they do not mean Google found these pages lacking or faulty. In this sample most of the audit score is lost not to something that broke but to information that has to be added to the page by hand.
Does an unmet SeoMods check mean a Google penalty?
No. “Not met” says the page did not pass a check defined by SeoMods in that scan. It does not show that Google has penalised the page, ranked it lower or judged it low quality. Some of the checks (llms.txt or the social preview tags, for instance) have no direct bearing on Google rankings; they are scored because they are within the scope of the SeoMods audit.
Are Open Graph and Twitter Card tags worth adding for SEO?
They are not ranking factors, but the audit scores them and they cost almost nothing: a few lines in the page head, written once in the template. Open Graph tags are missing in 53% of audits and a Twitter Card in 52%. What they buy is the preview — title, description and image — every time the page is shared; without them the link arrives bare. Being missing this often means easy points are still sitting on the table.