
This page is about one tool’s data: the E-E-A-T Analyzer. For how these scores sit alongside the other measures, the distributions in full and the methodology, see SEO Score Benchmarks.
Which trust signal is missing, and how often
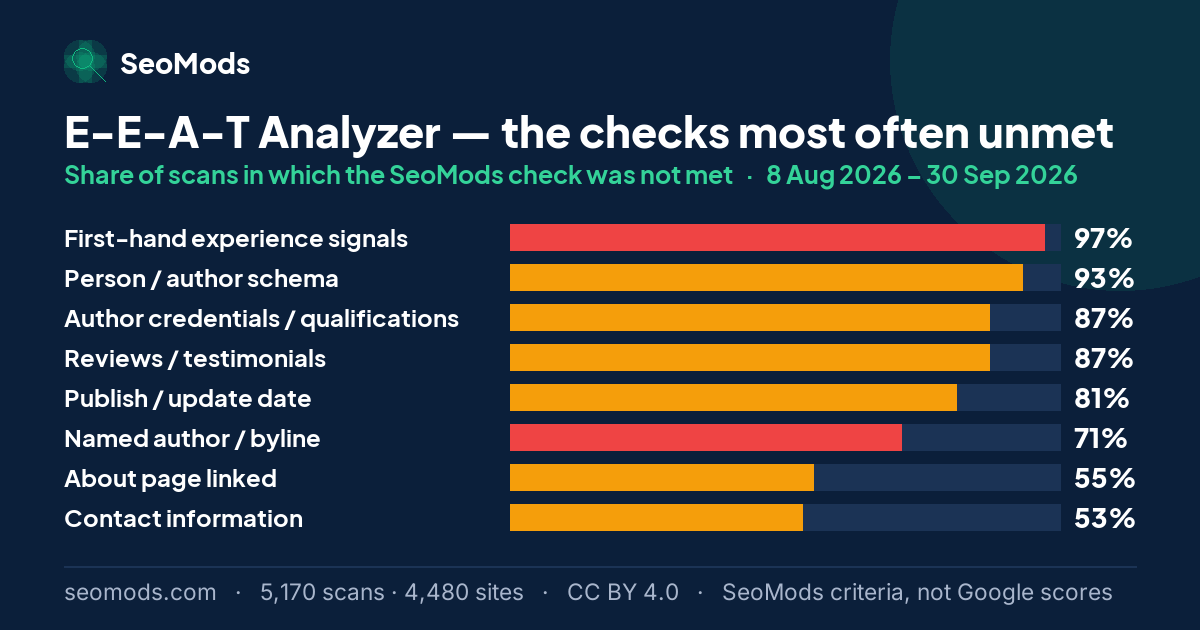
The tool takes a URL and runs eleven checks: first-hand experience language, original media, a named author, author credentials, Person schema, outbound citations, an About page, a publish date, HTTPS, contact information and reviews. All eleven are SeoMods’ own measurement criteria; that does not mean Google measures E-E-A-T this way. The percentage below is the share of runs in which the SeoMods check was not met.
| Check | Not met (share of scans) | Weight |
|---|---|---|
| First-hand experience signals | 97% | Hard fail |
| Person / author schema | 93% | Partial |
| Author credentials / qualifications | 87% | Partial |
| Reviews / testimonials | 87% | Partial |
| Publish / update date | 81% | Partial |
| Named author / byline | 71% | Hard fail |
| About page linked | 55% | Partial |
| Contact information | 53% | Partial |
| Cites authoritative sources | 30% | Partial |
| Original media | 21% | Partial |
| Secure (HTTPS) | 0% | Hard fail |
The rate is the share of scans in which a SeoMods check was not met. It is SeoMods’ criterion, not Google’s assessment of these pages. “Hard fail” means the check’s full weight is deducted from the SeoMods score; “partial” means part of it.
This table does not look like the others in the series: the first five items sit between 81% and 97%. On a typical page most of these signals are not present-with-gaps, they are simply absent. The average scan passes 4.3 of the eleven checks and leaves 6.7 open items behind it.
The HTTPS check, by contrast, was met in every scan in this sample. It is one of the checks SeoMods scores as a hard fail. One plausible explanation is that HTTPS is usually supplied by the host by default, while the other checks on the list depend on information added to the page by hand.
The lowest median of the main measures
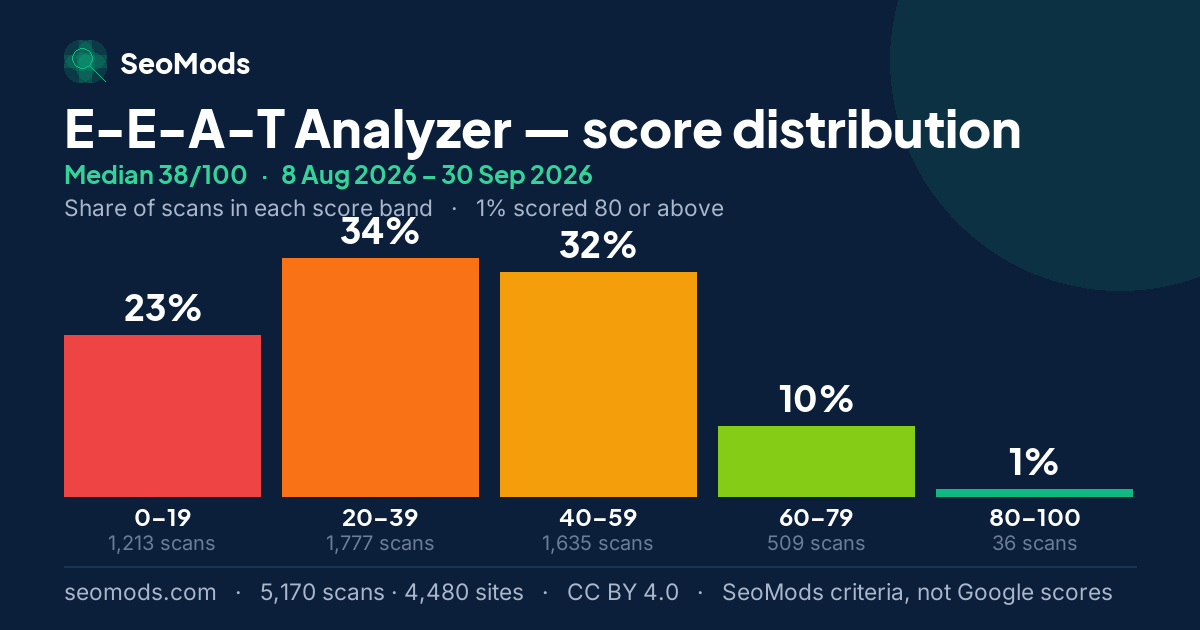
The median of the SeoMods E-E-A-T benchmark score is 38/100 and 78% of scans graded F — 4,024 runs. 2 scored A+. The distribution agrees: 57% of scans fall below 40 and only 1% climb above 80. That is the lowest median of the 6 main measures with a detail page — 52 points below Page Speed, the highest. Among all 25 tools with a published benchmark it ranks 20 by median.
Reading: those two ends are the two ends of the pattern seen across the main measures. On page speed the median SeoMods score is 90/100; here it is 38/100. One plausible explanation: part of what the speed checks ask for can be met by default by the host, the CDN or the framework, while the checks here look for information that has to be added to the page by hand — a name on the work, what was done, a date, a source. That is an inference; the data shows the gap between the two medians, not its cause.
There is a practical side to that. 36 scans scored 80 or above on this measure. An author byline, a date and two sentences of credentials close three SeoMods checks that go unmet in between 71% and 87% of scans. That raises the SeoMods E-E-A-T benchmark score; its effect on Google rankings was not measured by this data.
Two of the four letters carry the whole loss
The tool distributes its eleven checks across the four letters of E-E-A-T: Experience, Expertise, Authoritativeness and Trustworthiness. The weakest-category ranking shows exactly where the loss collects.
Experience was the lowest-scoring category in 53% of runs and Expertise in 43%, leaving the other two at a combined 4%. In this sample the loss is largely in the checks SeoMods ties to the first two letters: who wrote this, and language showing first-hand experience. The authority and trust checks — an About page, contact details, HTTPS — are mostly set up once for the whole site, while the checks tied to the first two letters are looked for page by page. How the checks are assigned to the letters is SeoMods’ own classification.
What this tool is actually measuring
Reading these figures correctly needs one distinction. E-E-A-T is not a score Google computes — it is a concept from a document written for human search quality raters. No tool can measure it directly. What can be measured is the machine-visible evidence associated with it: does the page name an author, is a qualification stated, is Person schema present, is a date visible, are sources cited. That is what the score here is — not the page’s actual trustworthiness and not an assessment by Google, but how many of the traces on SeoMods’ check list are present on the page.
First-hand experience language, author credentials, Person schema, a publication date and the rest are each a SeoMods measurement criterion: which trace is looked for, how it is detected and how much it weighs in the score are all set by SeoMods. Some of the same signals are measured on the AI visibility side too, where the author byline and the publish date are also among those most often missing. Two separate tools and two separate check lists point the same way; how a search engine or an AI system uses these signals cannot be inferred from this data.
Analyze a page’s E-E-A-T signals
Where does my score sit?
A score from the E-E-A-T Analyzer can be read against the five values below. All of them are calculated from the scans in this benchmark: they place a SeoMods score within this sample, not in Google’s results.
| Percentile | Score | What it means for a score |
|---|---|---|
| P10 | 8 | About one scan in ten scored 8 or lower. Below it, a page is in the lowest tenth of this sample. |
| P25 | 25 | The edge of the bottom quarter. A score under 25 is below about three quarters of the scans. |
| Median | 38 | The middle of the sample: half the scans scored lower, half higher. A score of 38 is the typical result here. |
| P75 | 47 | Where the top quarter begins. A score of 47 or more is at or above about three quarters of the scans. |
| P90 | 60 | Where the top tenth begins. A score of 60 or more is among the highest 10% of scans in this sample. |
Percentiles describe the sites SeoMods scanned, not the whole web, and they apply to this tool only: the same number on another tool sits somewhere else.
The charts
The charts below carry this page’s figures in a form that can leave it: each one states the tool, the period and the sample on the image itself. They are free to reuse under CC BY 4.0 with a link back to this page.
Month by month
This page adds every published month together. Underneath it, each month is frozen as an edition of its own whose figures are never edited again — which is the only reason two months can be set side by side at all. Below is the E-E-A-T Analyzer across the 2 published editions, with the combined figure in the last row of the table.
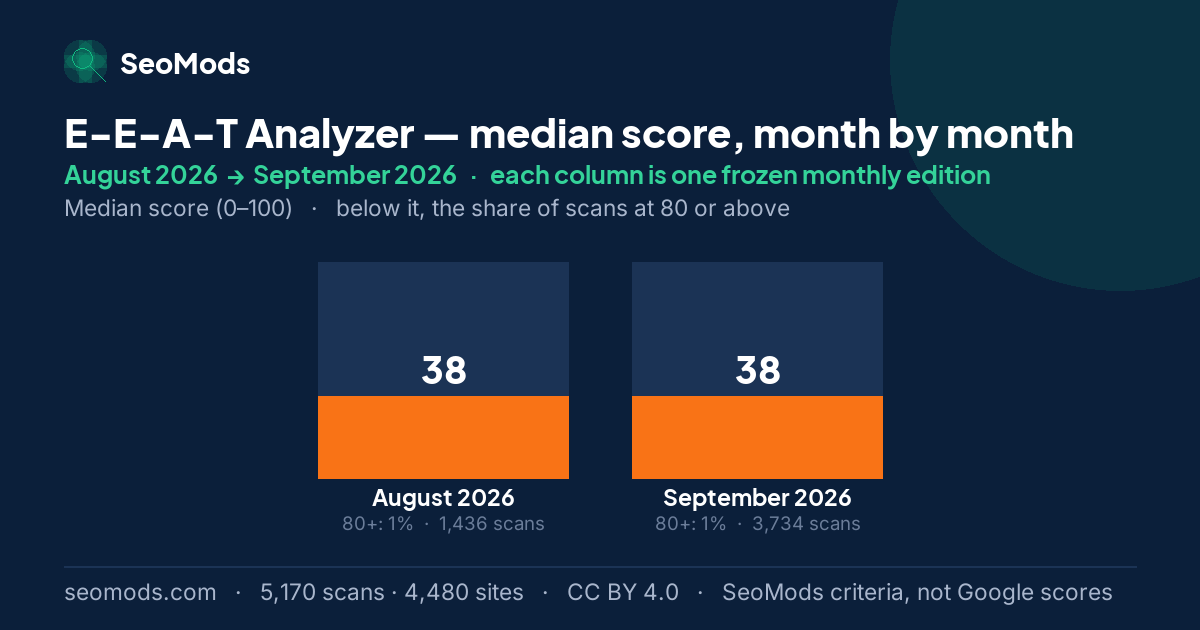
Between August 2026 and September 2026 the median held at 38, and the share of scans at 80 or above held at 1%. The two months do not measure the same sites — the September 2026 sample has about 3 times as many sites — so read the gap as a change in the cross-section measured, not as the same sites getting better or worse.
| Edition | Median | vs. previous | Scored 80+ | Issues/run | Runs |
|---|---|---|---|---|---|
| August 2026 | 38 | baseline | 1% | 6.6 | 1,436 |
| September 2026 | 38 | no change | 1% | 6.8 | 3,734 |
| All published months, combined | 38 | — | 1% | 6.7 | 5,170 |
Reading a monthly difference. Each month is a separate sample, and its size changes from month to month. A change in sample size can move a median and a distribution by itself, so a monthly difference should not be mistaken for a change in scores: it does not show that sites improved or got worse.
Which checks moved
Each check’s rate in the first edition that measured it, beside its rate in the latest. Moves under two points are marked as no change: these are independent monthly samples of a shifting set of sites, and a difference that small is not evidence that anything on the web changed.
| Check | Not met in August 2026 | Not met in September 2026 | Change |
|---|---|---|---|
| About page linked | 47% · August 2026 | 58% · September 2026 | +11 pp |
| Named author / byline Hard fail | 76% · August 2026 | 68% · September 2026 | −8 pp |
| Cites authoritative sources | 25% · August 2026 | 32% · September 2026 | +7 pp |
| Publish / update date | 84% · August 2026 | 80% · September 2026 | −4 pp |
| Reviews / testimonials | 84% · August 2026 | 88% · September 2026 | +4 pp |
| Person / author schema | 91% · August 2026 | 94% · September 2026 | +3 pp |
| Author credentials / qualifications | 85% · August 2026 | 88% · September 2026 | +3 pp |
| Contact information | 55% · August 2026 | 52% · September 2026 | −3 pp |
| Original media | 19% · August 2026 | 22% · September 2026 | +3 pp |
| First-hand experience signals Hard fail | 96% · August 2026 | 97% · September 2026 | no change |
| Secure (HTTPS) Hard fail | 0% · August 2026 | 1% · September 2026 | no change |
What this score does not measure
- It is not Google’s E-E-A-T score. Google publishes no such score; E-E-A-T is a concept from its search quality rater guidelines.
- It does not measure how trustworthy a page or an author really is. It counts the machine-visible evidence of it that is present on the page.
- It is not a Google ranking. A high score does not guarantee a better position, and a low one does not mean Google has penalised the page.
About this benchmark. This benchmark is calculated from data on the sites SeoMods has scanned. The results do not necessarily represent all websites, or a random selection of them. The scores express SeoMods’ own measurement and scoring criteria; they are not ranking, quality, E-E-A-T or AI visibility scores issued by Google. Sample, anonymization and licence: the full methodology.
Frequently asked questions
What is a typical SeoMods E-E-A-T benchmark score?
In this dataset the median of the SeoMods E-E-A-T benchmark score is 38/100 and 78% of scans graded F. The 25th percentile is 25 and the 75th is 47; only 1% of scans (36 runs) reached 80 or above. What that means in practice is that most scores in this sample are low, so 60 or above is in the top 10%. That is a position on SeoMods’ check list; it does not show how Google assesses the page.
Is E-E-A-T a ranking factor?
Not directly, and the distinction matters. E-E-A-T is not a score Google computes; it is a concept from the guidelines that human search quality raters use when judging pages. No tool can measure it directly. What a tool can measure is the machine-visible evidence associated with it: is there an author name, is a qualification stated, is Person schema in place, is a date visible, are sources cited. That is exactly what the score on this page is — not a Google E-E-A-T score, but a benchmark score calculated against SeoMods’ own checklist. Which checks are on the list and how much each weighs is SeoMods’ choice.
Which E-E-A-T signal is missing most often?
First-hand experience signals — absent from 97% of pages. The tool measures it by looking for language in the text that demonstrates first-hand use: "we tested", "I tried", "in our experience". Its absence does not mean the content is bad or was written without experience; it means the kind of phrase the tool looks for is not on the page. This check is a SeoMods criterion inspired by the “experience” concept added to Google’s search quality rater guidelines in 2022; it is not a measurement Google makes.
Why do so many pages grade F?
Because both of the checks SeoMods scores as hard fails look for information that has to be added to the page by hand, and in this sample both usually go unmet: first-hand experience is missing from 97% of pages and a named author from 71%. The average page passes only 4.3 of the eleven checks and leaves 6.7 open items behind it, of which 1.67 are hard fails. The F grade follows SeoMods’ own grade scale (below 50); it is not a grade Google gives these pages.