
This page is about one tool’s data: the Meta Tag Analyzer. For where these scores stand among the 25 tools with a published benchmark, and the distributions in full, see SEO Score Benchmarks — the methodology and privacy notes are there too.
Which tag is missing, and how often
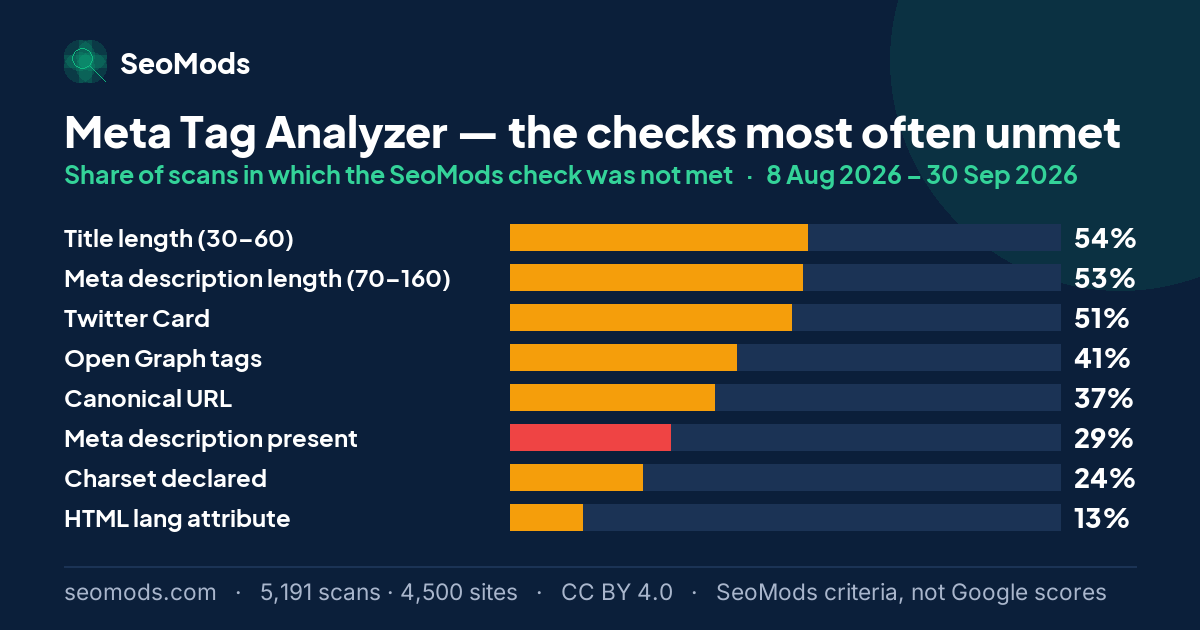
The tool takes a URL, fetches the page’s <head> and runs ten checks: the presence and the length of the title and description, the canonical, the charset, the viewport, the language attribute, Open Graph and Twitter Card. It asks for no keyword — so what it measures is not how well a page matches a query but how far its tags meet SeoMods’ criteria. The percentage below is the share of runs in which the SeoMods check was not met.
| Check | Not met (share of scans) | Weight |
|---|---|---|
| Title length (30–60) | 54% | Partial |
| Meta description length (70–160) | 53% | Partial |
| Twitter Card | 51% | Partial |
| Open Graph tags | 41% | Partial |
| Canonical URL | 37% | Partial |
| Meta description present | 29% | Hard fail |
| Charset declared | 24% | Partial |
| HTML lang attribute | 13% | Partial |
| Mobile viewport | 11% | Hard fail |
| Title tag present | 3% | Hard fail |
The rate is the share of scans in which a SeoMods check was not met. It is SeoMods’ criterion, not Google’s assessment of these pages. “Hard fail” means the check’s full weight is deducted from the SeoMods score; “partial” means part of it.
The three items at the bottom of the table — the language attribute missing in 13% of runs, the viewport in 11% and the title tag itself in 3%. Most CMSs ship all three by default; when they are absent it may well point to a hand-written page or a template left half-finished.
Not absence: the length is outside the SeoMods target range
Data: the two items at the top of the list are length checks. The title is outside the SeoMods target range (30–60 characters) in 54% of runs and the meta description outside its target range (70–160 characters) in 53%. The tag being absent altogether is far rarer — no title tag in 3% of runs and no meta description in 29%. Reading: in this sample nearly every page writes a title; about half write one whose length falls outside the SeoMods target range.
These ranges are not Google rules. By the SeoMods benchmark criterion, titles of 30–60 characters and meta descriptions of 70–160 characters count as inside the target range. Google, though, sets no fixed character limit for either: what a search result shows depends on the device and the pixel width rather than on a character count, and Google may also rewrite the title or the description for the query. So falling outside the target range is not a “Google error”; it is partial credit lost on the SeoMods score. The range exists to give a practical target that makes it more likely the text is shown unshortened in most search results.
The category view lands in the same place: Title & description is the lowest-scoring category in 48% of runs. The average scan passes 6.8 of the ten checks and leaves 3.2 open items behind it, of which only 0.43 are scored as hard fails.
Sharing tags: the loss nobody notices
Open Graph tags are missing in 41% of runs, a Twitter Card in 51% and a canonical URL in 37% — and Social tags is the weakest category in 40% of runs. What these three share is that their absence shows no symptom on the site itself: the page looks normal and nothing moves in analytics. The difference only appears once the link is shared somewhere else, as an empty box with no headline and no image. Without a canonical tag, wherever the same content is reachable from more than one address the choice of which one counts is left to the search engine; a canonical is not a requirement but a hint that steers that choice.
Where does my score sit?
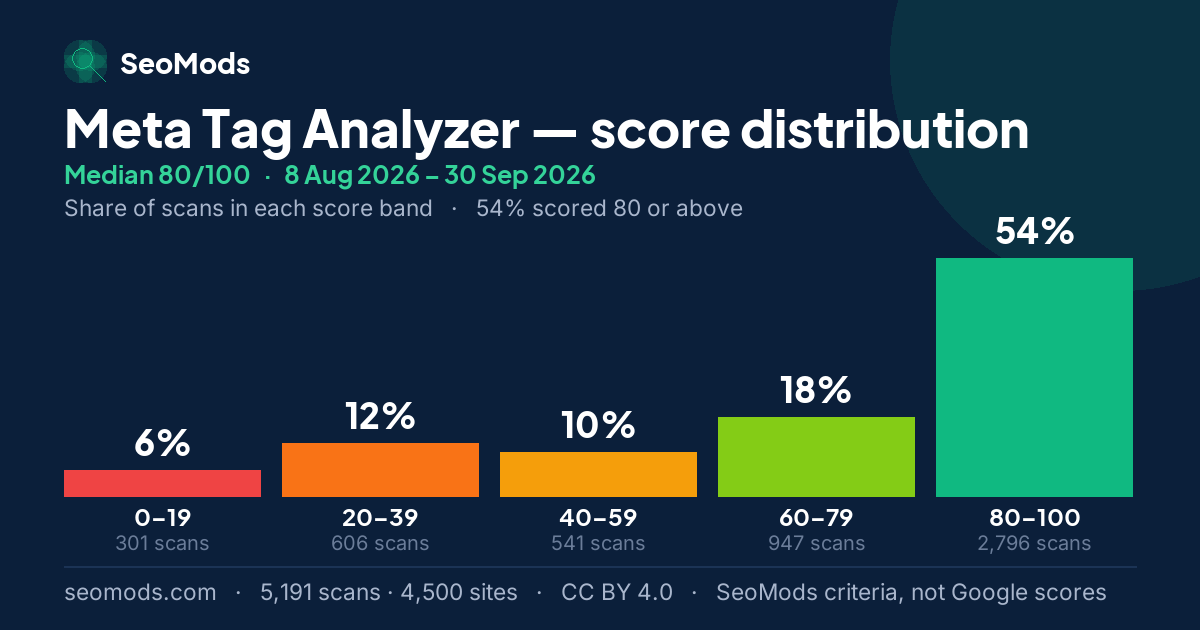
A score from the Meta Tag Analyzer can be read against the five values below. All of them are calculated from the scans in this benchmark: they place a SeoMods score within this sample, not in Google’s results.
| Percentile | Score | What it means for a score |
|---|---|---|
| P10 | 30 | About one scan in ten scored 30 or lower. Below it, a page is in the lowest tenth of this sample. |
| P25 | 53 | The edge of the bottom quarter. A score under 53 is below about three quarters of the scans. |
| Median | 80 | The middle of the sample: half the scans scored lower, half higher. A score of 80 is the typical result here. |
| P75 | 90 | Where the top quarter begins. A score of 90 or more is at or above about three quarters of the scans. |
| P90 | 100 | Where the top tenth begins. A score of 100 or more is among the highest 10% of scans in this sample. |
Percentiles describe the sites SeoMods scanned, not the whole web, and they apply to this tool only: the same number on another tool sits somewhere else.
The charts
The charts below carry this page’s figures in a form that can leave it: each one states the tool, the period and the sample on the image itself. They are free to reuse under CC BY 4.0 with a link back to this page.
Month by month
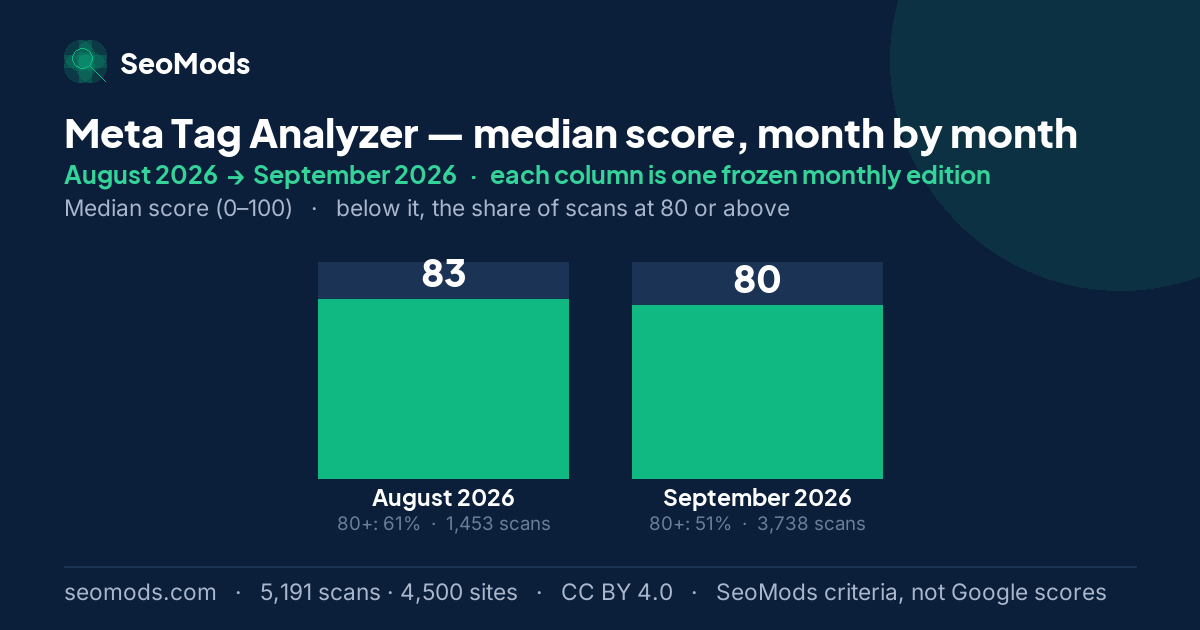
This page adds every published month together. Underneath it, each month is frozen as an edition of its own whose figures are never edited again — which is the only reason two months can be set side by side at all. Below is the Meta Tag Analyzer across the 2 published editions, with the combined figure in the last row of the table.
Between August 2026 and September 2026 the median went from 83 to 80, and the share of scans at 80 or above went from 61% to 51%. The two months do not measure the same sites — the September 2026 sample has about 3 times as many sites — so read the gap as a change in the cross-section measured, not as the same sites getting better or worse.
| Edition | Median | vs. previous | Scored 80+ | Issues/run | Runs |
|---|---|---|---|---|---|
| August 2026 | 83 | baseline | 61% | 2.8 | 1,453 |
| September 2026 | 80 | −3 pts | 51% | 3.3 | 3,738 |
| All published months, combined | 80 | — | 54% | 3.2 | 5,191 |
Reading a monthly difference. Each month is a separate sample, and its size changes from month to month. A change in sample size can move a median and a distribution by itself, so a monthly difference should not be mistaken for a change in scores: it does not show that sites improved or got worse.
Which checks moved
Each check’s rate in the first edition that measured it, beside its rate in the latest. Moves under two points are marked as no change: these are independent monthly samples of a shifting set of sites, and a difference that small is not evidence that anything on the web changed.
| Check | Not met in August 2026 | Not met in September 2026 | Change |
|---|---|---|---|
| Twitter Card | 39% · August 2026 | 55% · September 2026 | +16 pp |
| Open Graph tags | 31% · August 2026 | 46% · September 2026 | +15 pp |
| Title length (30–60) | 52% · August 2026 | 56% · September 2026 | +4 pp |
| Meta description length (70–160) | 51% · August 2026 | 54% · September 2026 | +3 pp |
| HTML lang attribute | 11% · August 2026 | 14% · September 2026 | +3 pp |
| Mobile viewport Hard fail | 9% · August 2026 | 12% · September 2026 | +3 pp |
| Canonical URL | 35% · August 2026 | 37% · September 2026 | no change |
| Meta description present Hard fail | 27% · August 2026 | 29% · September 2026 | no change |
| Charset declared | 23% · August 2026 | 24% · September 2026 | no change |
| Title tag present Hard fail | 4% · August 2026 | 3% · September 2026 | no change |
What this score does not measure
- It is not a Google ranking. A high score does not guarantee a better position, and a low one does not mean Google has penalised the page.
- It is not a test of compliance with a Google length rule. Google sets no fixed character limit for titles or meta descriptions; the ranges are SeoMods target ranges.
- It is not an organic traffic estimate. No click, impression or visit data goes into it.
About this benchmark. This benchmark is calculated from data on the sites SeoMods has scanned. The results do not necessarily represent all websites, or a random selection of them. The scores express SeoMods’ own measurement and scoring criteria; they are not ranking, quality, E-E-A-T or AI visibility scores issued by Google. Sample, anonymization and licence: the full methodology.
Frequently asked questions
What title length does SeoMods target?
By the SeoMods benchmark criterion, titles of 30–60 characters count as inside the target range. That is not a Google rule: Google sets no fixed character limit for titles, and may shorten or rewrite the title it shows depending on the device, the query and the pixel width. In this dataset 54% of runs fall outside the SeoMods target range — that counts both titles under 30 characters and titles past 60. A title outside the target range is not an error as far as Google is concerned; the practical advice is to put the distinguishing phrase first, because the end of a long title may not be shown in a search result.
Is the meta description still necessary?
The meta description is not a Google ranking factor, and Google may show text of its own choosing from the page in a search result. In this sample 29% of runs have no meta description at all, and, counting those, 53% fall outside the SeoMods target range (70–160 characters). That range is a SeoMods benchmark criterion too, not a limit set by Google. The SeoMods scoring treats "absent" as a hard fail and "outside the target range" as partial credit lost.
Do Open Graph and Twitter Card tags affect SEO?
Not rankings directly — they decide what the page looks like when someone shares it. They do come second on the weakness ranking, though: Social tags was the lowest-scoring category in 40% of runs. Open Graph tags are missing in 41% of runs and a Twitter Card in 51%. Without them, every link posted to a social network or pasted into a chat renders as a bare box with no headline and no image.
Why do the scores cluster at the extremes?
Because there are only ten checks, and a page’s tag layer tends to be either set up or not set up at all. 906 runs scored A+ while 1,138 scored F, with just 446 runs in the C band between them. Install a theme or an SEO plugin and most of these tags arrive together; install neither and none of them do.