
This page is about one tool’s data: the Page Speed & Size Test. For how these scores sit alongside the other measures, the distributions in full and the methodology, see SEO Score Benchmarks.
Which speed check goes unmet, and how often
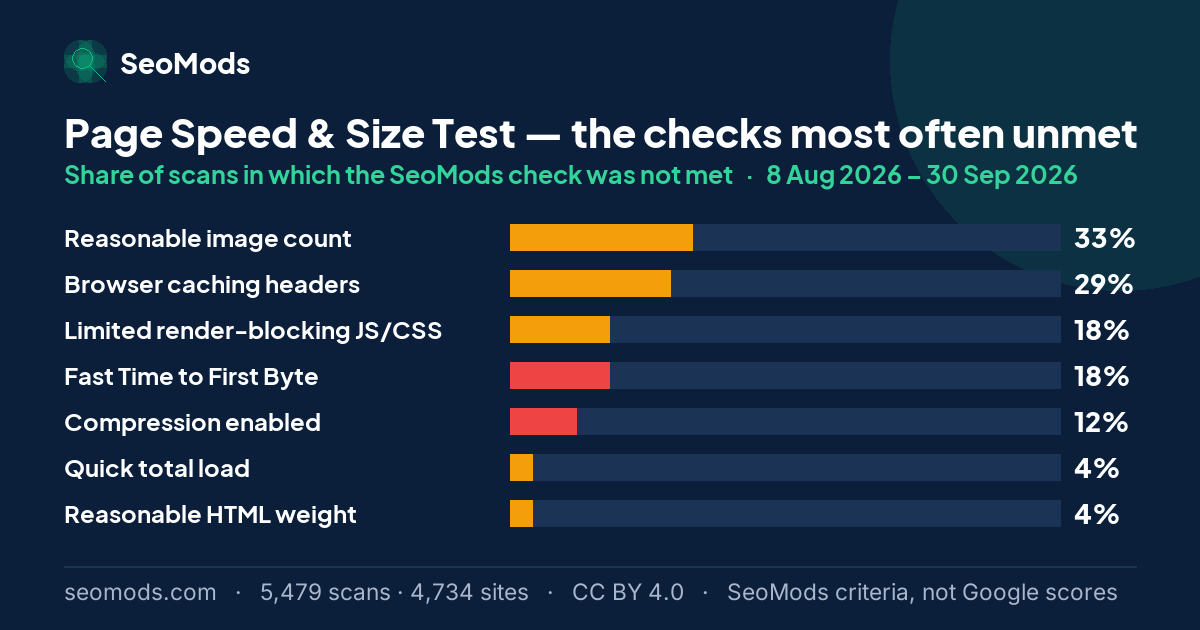
The tool takes a URL, fetches the page once from the server side and runs seven checks: time to first byte, total load, compression, caching headers, HTML weight, the number of render-blocking files and the number of images. The percentage below is the share of runs in which the SeoMods check was not met.
| Check | Not met (share of scans) | Weight |
|---|---|---|
| Reasonable image count | 33% | Partial |
| Browser caching headers | 29% | Partial |
| Limited render-blocking JS/CSS | 18% | Partial |
| Fast Time to First Byte | 18% | Hard fail |
| Compression enabled | 12% | Hard fail |
| Quick total load | 4% | Partial |
| Reasonable HTML weight | 4% | Partial |
The rate is the share of scans in which a SeoMods check was not met. It is SeoMods’ criterion, not Google’s assessment of these pages. “Hard fail” means the check’s full weight is deducted from the SeoMods score; “partial” means part of it.
Data: the average scan meets 5.8 of the seven checks and leaves 1.2 open items behind it — the shortest list of open items among the 6 main measures compared on the hub. 2 checks are scored as hard fails; the rest are partial. Reading: a large share of the unmet checks relate less to the content of the page than to the infrastructure, delivery and technical performance layers: caching headers, compression, server response time. The image count and render-blocking files depend on how the page itself is built.
Why scores are high in this sample
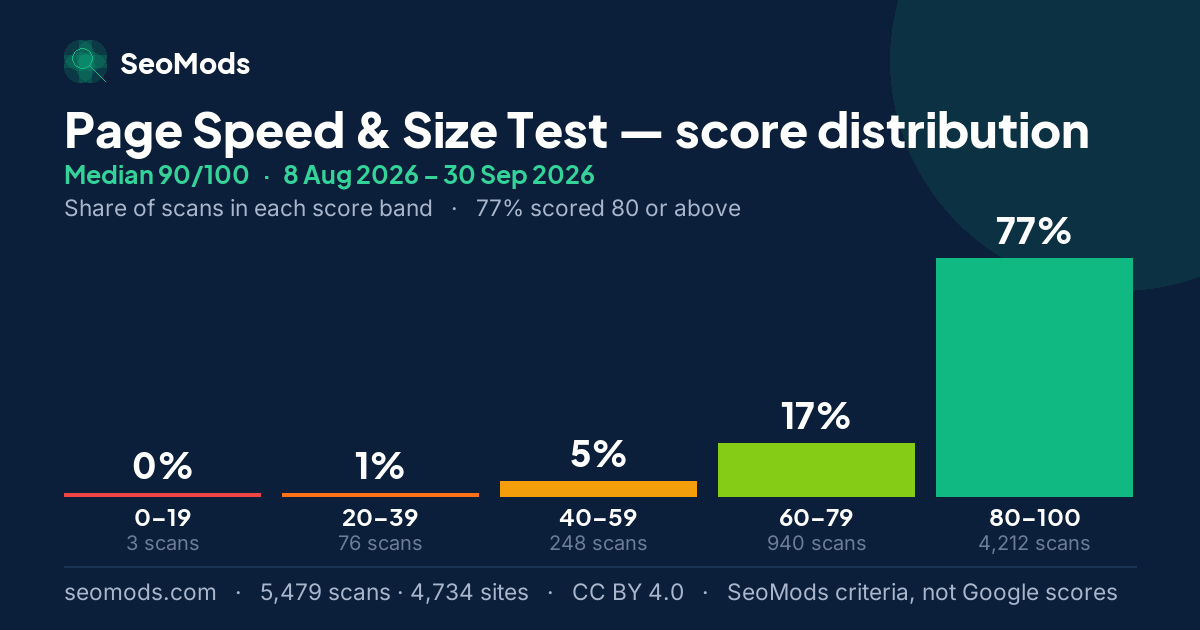
77% of scans score 80 or above, and the 75th percentile sits at 100 — a quarter of the sample is at or near a perfect score. 148 scans graded F against 1,379 at A+. Reading: one plausible explanation is that what is being measured is the delivery layer: compression, caching headers and server response time can often be supplied by default by a host, a CDN or a managed platform. That does not mean speed depends on infrastructure alone: images, scripts and page weight are decisions made by whoever builds the page.
Which is why a SeoMods speed score should not be read as an achievement on its own. A page scoring 90 here has not been shown to be faster than its competitors, or fast for real users; it has been shown to meet the delivery checks SeoMods measures. For comparison: on E-E-A-T the median of the SeoMods benchmark score is 38/100.
The category split says the same thing: Speed & Delivery was the lowest-scoring category in 62% of runs and Payload & Requests in 38%. In this sample the SeoMods score is lost on delivery checks more often than on page weight and request count.
Both hard-fail checks are server-side
Two of the seven checks are scored by SeoMods as hard fails, and both concern server configuration. Time to first byte is over its threshold in 18% of runs; compression is not switched on at all in 12%. The second is the striking one, because enabling Gzip or Brotli typically cuts text transfer by 60–80% and is a single server setting — no content changes, no template changes, no page rewritten. Total load time, meanwhile, exceeds its limit in only 4% of runs.
The practical consequence is that part of the work that raises a SeoMods score on this measure is done on the server. Switching on compression, setting Cache-Control headers and cutting the server response time are usually applied once, for the entire site. The image count and render-blocking files are the items that have to be dealt with page by page. These steps improve the SeoMods score; seeing their effect on real-user experience takes a browser-based measurement and field data.
What this score does not measure
- It is not a Google PageSpeed Insights score. Nothing here is run in a browser, and Core Web Vitals (LCP, INP, CLS) are not measured.
- It does not represent the whole of the real user experience. What is measured is one URL’s HTML and server response at the moment of the scan.
- It is not a Google ranking. A high score does not guarantee a better position, and a low one does not mean Google has penalised the page.
Reading these figures correctly means knowing where the measurement stops. The tool fetches the page once from the server side and measures the connection, the first byte, the size of the response and its headers. It does not open the page in a browser or execute JavaScript; it cannot see the largest contentful paint (LCP), layout shift (CLS) or interaction delay (INP), and it does not look at real-user data. Those are Google’s Core Web Vitals, measured by PageSpeed Insights and the Chrome User Experience Report; the SeoMods score stands in for none of them and should not be compared with them. Scoring 90 here means the delivery checks SeoMods measures are met; it does not mean Core Web Vitals pass. A page shipping a heavy JavaScript bundle can come out of this test with a high score and still be slow on an actual phone.
About this benchmark. This benchmark is calculated from data on the sites SeoMods has scanned. The results do not necessarily represent all websites, or a random selection of them. The scores express SeoMods’ own measurement and scoring criteria; they are not ranking, quality, E-E-A-T or AI visibility scores issued by Google. Sample, anonymization and licence: the full methodology.
Where does my score sit?
A score from the Page Speed & Size Test can be read against the five values below. All of them are calculated from the scans in this benchmark: they place a SeoMods score within this sample, not in Google’s results.
| Percentile | Score | What it means for a score |
|---|---|---|
| P10 | 65 | About one scan in ten scored 65 or lower. Below it, a page is in the lowest tenth of this sample. |
| P25 | 80 | The edge of the bottom quarter. A score under 80 is below about three quarters of the scans. |
| Median | 90 | The middle of the sample: half the scans scored lower, half higher. A score of 90 is the typical result here. |
| P75 | 100 | Where the top quarter begins. A score of 100 or more is at or above about three quarters of the scans. |
| P90 | 100 | Where the top tenth begins. A score of 100 or more is among the highest 10% of scans in this sample. |
Some of these values coincide. That happens when many scans land on exactly the same score, so the bands between them are not separate bands at all — read the equal values as one step.
Percentiles describe the sites SeoMods scanned, not the whole web, and they apply to this tool only: the same number on another tool sits somewhere else.
The charts
The charts below carry this page’s figures in a form that can leave it: each one states the tool, the period and the sample on the image itself. They are free to reuse under CC BY 4.0 with a link back to this page.
Month by month
This page adds every published month together. Underneath it, each month is frozen as an edition of its own whose figures are never edited again — which is the only reason two months can be set side by side at all. Below is the Page Speed & Size Test across the 2 published editions, with the combined figure in the last row of the table.
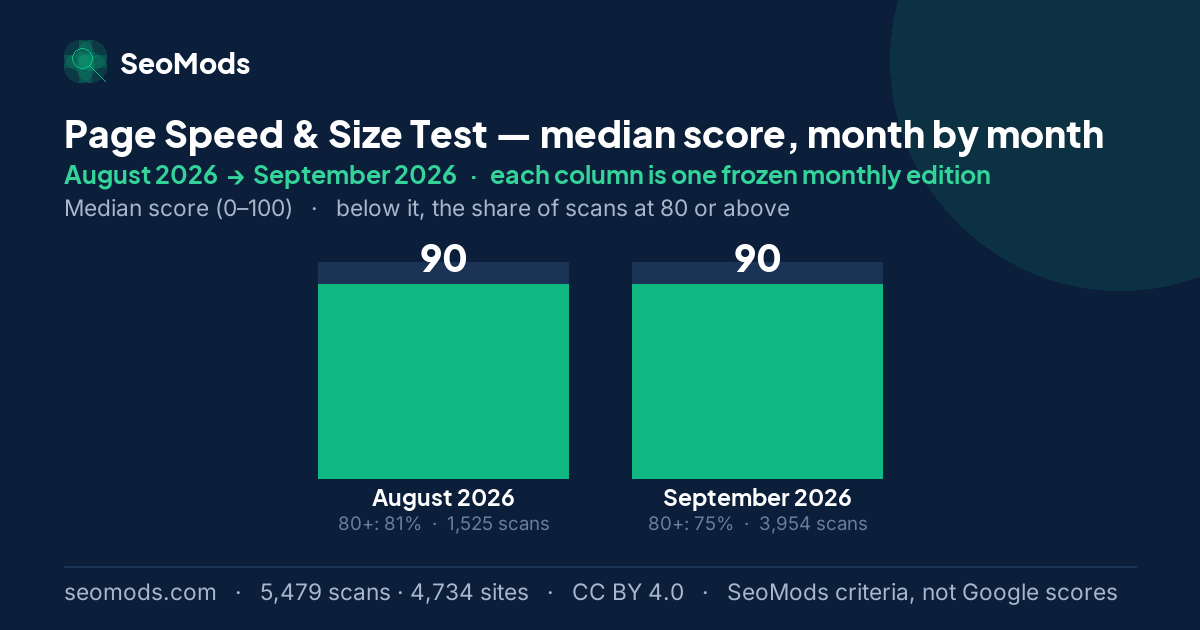
Between August 2026 and September 2026 the median held at 90, and the share of scans at 80 or above went from 81% to 75%. The two months do not measure the same sites — the September 2026 sample has about 3 times as many sites — so read the gap as a change in the cross-section measured, not as the same sites getting better or worse.
| Edition | Median | vs. previous | Scored 80+ | Issues/run | Runs |
|---|---|---|---|---|---|
| August 2026 | 90 | baseline | 81% | 1.1 | 1,525 |
| September 2026 | 90 | no change | 75% | 1.2 | 3,954 |
| All published months, combined | 90 | — | 77% | 1.2 | 5,479 |
Reading a monthly difference. Each month is a separate sample, and its size changes from month to month. A change in sample size can move a median and a distribution by itself, so a monthly difference should not be mistaken for a change in scores: it does not show that sites improved or got worse.
Which checks moved
Each check’s rate in the first edition that measured it, beside its rate in the latest. Moves under two points are marked as no change: these are independent monthly samples of a shifting set of sites, and a difference that small is not evidence that anything on the web changed.
| Check | Not met in August 2026 | Not met in September 2026 | Change |
|---|---|---|---|
| Fast Time to First Byte Hard fail | 13% · August 2026 | 20% · September 2026 | +7 pp |
| Quick total load | 1% · August 2026 | 5% · September 2026 | +4 pp |
| Browser caching headers | 27% · August 2026 | 30% · September 2026 | +3 pp |
| Reasonable HTML weight | 5% · August 2026 | 3% · September 2026 | no change |
| Reasonable image count | 34% · August 2026 | 33% · September 2026 | no change |
| Limited render-blocking JS/CSS | 19% · August 2026 | 18% · September 2026 | no change |
| Compression enabled Hard fail | 12% · August 2026 | 13% · September 2026 | no change |
Frequently asked questions
What is a good page speed score?
In this dataset the median is 90/100, so a typical page already scores high. 77% of scans reach 80 or above; the 25th percentile is 80 and the 10th is 65. The practical reading is that 80 does not set a page apart in this sample; the top 10% begins at 100. That is where a SeoMods score sits within the sample — it says nothing about a PageSpeed Insights or Core Web Vitals result.
Is 90 here the same as 90 in PageSpeed Insights?
No, and the two should not be read side by side. This tool makes a single server-side request and measures the connection, the time to first byte, the size of the response and its headers. It does not run the page in a browser, execute JavaScript, or observe layout shift or interaction delay. PageSpeed Insights combines field data from real Chrome users with a full browser trial. A high score here means the delivery checks SeoMods measures are met; it does not mean Core Web Vitals pass. The SeoMods score is not issued by Google.
Which SeoMods speed check goes unmet most often?
Reasonable image count — this SeoMods check is not met in 33% of runs. Browser caching headers follow at 29% and render-blocking JS/CSS at 18%. All three are scored by SeoMods as partial credit lost rather than hard fails.
Does time to first byte matter more than total load time?
In this sample the question answers itself: total load time exceeds the threshold in only 4% of runs, while time to first byte is over its limit in 18%. TTFB is scored as a hard fail because while the browser waits for the first byte it can download nothing, parse nothing and paint nothing. That weighting is SeoMods’ scoring choice; because this tool does not measure browser-side loading or real-user metrics, the two cannot be set against Google’s metrics.