How it works
- Paste the full URL you want to measure (for example
https://example.com). - The tool sends a real HTTP request and times each stage of the response.
- It reads the transferred bytes, content-encoding and headers from the live response.
- You get clear numbers for TTFB, total time, page weight and compression status.
What it measures
- TTFB (Time To First Byte) — how quickly the server starts responding.
- Total load time — the full time to download the HTML response.
- Page weight — total transferred size in KB, the smaller the better.
- Compression — whether Gzip or Brotli is applied to the response.
- Request size — the bytes sent and returned for the page.
- HTTP status — the response code confirming the page loaded.
Common use cases
- Diagnosing slow pages — see whether the server (TTFB) or page weight is the bottleneck.
- Hosting comparison — benchmark response times before and after a server move.
- Compression checks — confirm text resources are being compressed.
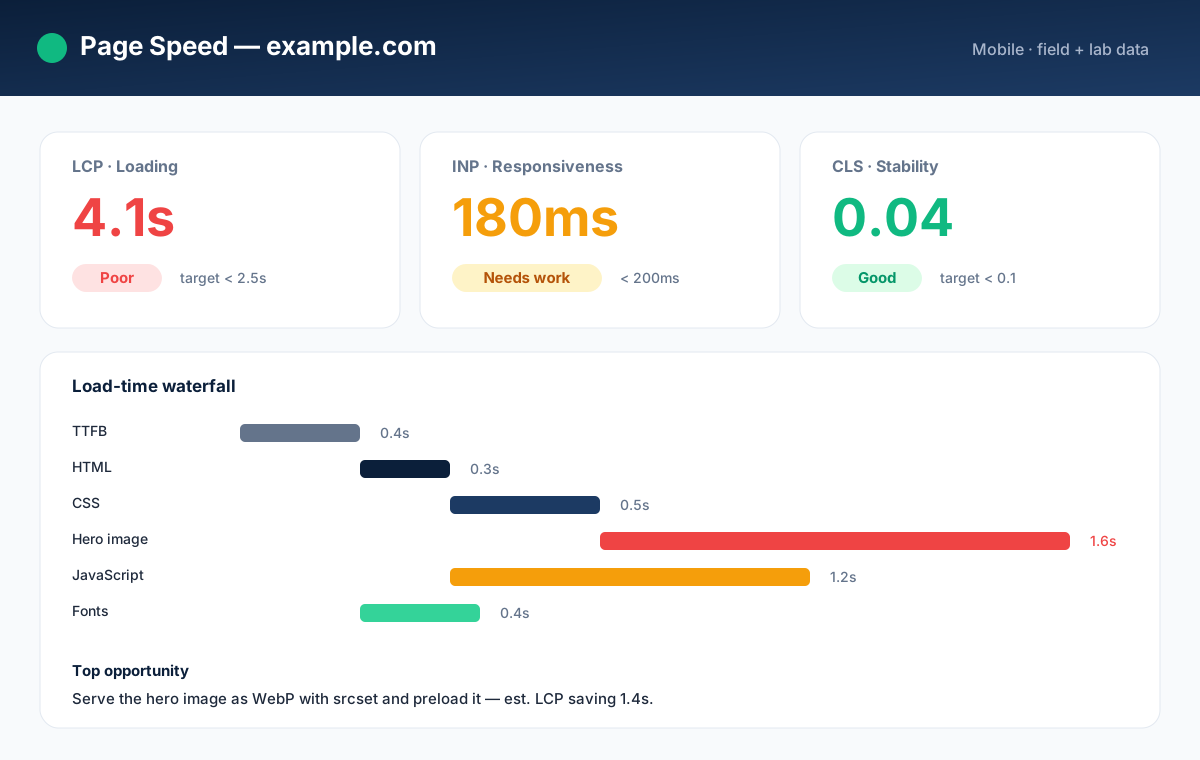
- Core Web Vitals prep — fix server speed that feeds into real-user metrics.
Example
Run the tool on a homepage and you might see a TTFB of 480 ms, a total load time of 1.2 s, a page weight of 310 KB and Gzip enabled. A slow TTFB above 800 ms would point to a server or caching issue, while a large page weight would point to bloated HTML or unoptimized assets.
Frequently asked questions
Is the Page Speed & Size Test free?
Yes — completely free, with no signup and no usage limits. Measure as many URLs as you like.
What is a good TTFB?
Under 200 ms is excellent and under 800 ms is generally acceptable. Higher values usually mean slow server processing, missing caching or distant hosting.
How do I check compression separately?
Use the Gzip / Brotli Compression Test to confirm Gzip or Brotli savings, and the HTTP Header Checker to inspect caching headers, then follow our page speed optimization guide and Core Web Vitals guide to improve real-user performance.