
The four figures below are for the series’ flagship tool, the All-in-One SEO Audit. Every other tool’s numbers are in the ranking further down.
This is the October 2026 edition. Every figure below comes only from scans run inside that month, and none of them will change again — a rate you quote today will still be at this address years from now. Each one is set against the month before, the September 2026 edition; what rose and what fell is the first section. For every published month added together, go to SEO Score Benchmarks: that page is refreshed each time a month is added. The figures here never are.
| Data period | 1 October 2026 – 31 October 2026 |
|---|---|
| Unique sites | 22,497 |
| Total scans | 89,498 |
| Benchmarks / tools | 25 |
| Minimum sample | at least 500 scans per tool in the month |
| Data frozen on | 11 November 2026 |
A monthly snapshot does not change after it is published: the figures on this page stay exactly as they were frozen on that date.
What changed since September 2026
Set against September 2026, 12 of the 25 tools had a higher median, 10 the same and 3 a lower one. The largest fall was on the NLP Content Analyzer, where the median went from 65 to 56. The largest rise was on the Entity Extractor, from 58 to 79.
Before reading anything into that, look at the sample. October 2026 covers 89,498 scans of 22,497 sites, against 86,983 scans of 22,549 in September 2026. The two months are not the same sites measured twice; they are two different cross-sections. A median that moved may be reporting who was measured as much as what changed.
Reading a monthly difference. The two months are close in size, but they are not the same set of sites. A different mix of sites can move a median and a distribution by itself, so a monthly difference is not a change in scores: it does not show that sites improved or got worse.
- September 2026
- October 2026 — median up
- October 2026 — median down
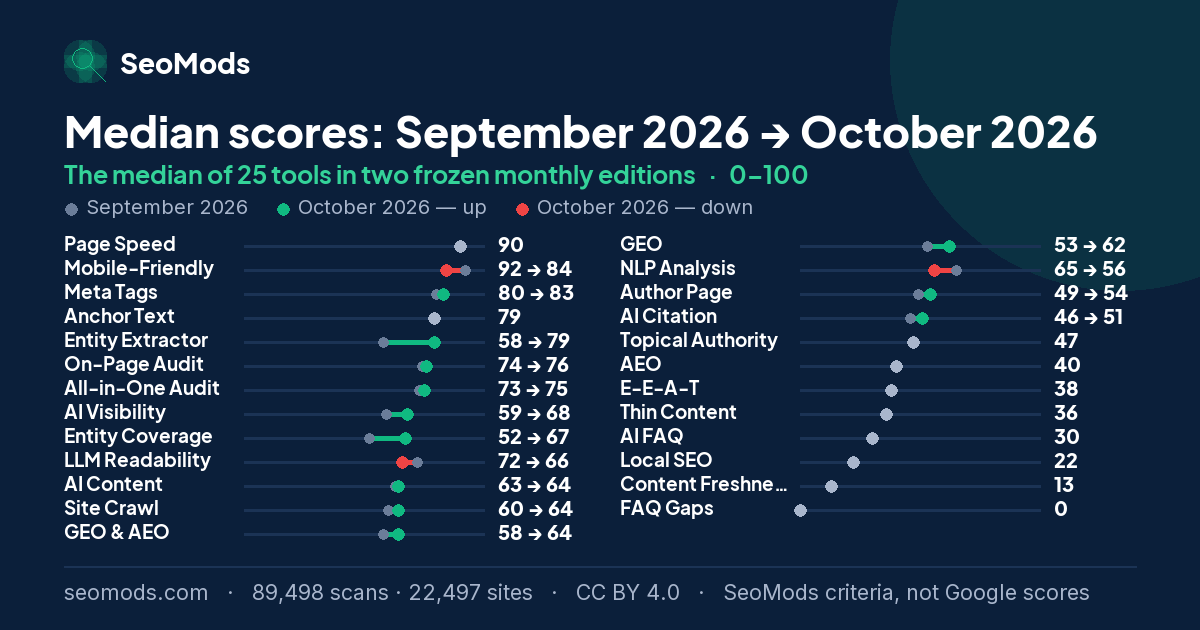
The same figures as a table are below; each tool name leads to that tool’s own October 2026 page, where its checks are compared one by one. Moves under half a point are marked “no change”: on a sample this size a difference that small is measurement noise, and dressing it up as a trend is the fastest way to make a benchmark series untrustworthy.
| Tool | Median then | Median now | Change | Scored 80+ | Issues/run |
|---|---|---|---|---|---|
| Entity Extractor | 58 | 79 | +21 pts | 24% +5 pp | 1.5 −0.4 |
| Entity Coverage Analyzer | 52 | 67 | +15 pts | 29% +2 pp | 2.4 −0.1 |
| AI Visibility Checker | 59 | 68 | +9 pts | 29% +5 pp | 5.7 −0.8 |
| GEO Checker (Generative Engine Optimization) | 53 | 62 | +9 pts | 23% +6 pp | 6.7 −0.8 |
| NLP Content Analyzer | 65 | 56 | −9 pts | 10% no change | 2.9 no change |
| Mobile-Friendly Checker | 92 | 84 | −8 pts | 60% −5 pp | 2.0 no change |
| GEO & AEO Readiness Checker | 58 | 64 | +6 pts | 19% +6 pp | 14.4 −1.7 |
| LLM Readability Score | 72 | 66 | −6 pts | 33% −6 pp | 3.3 +0.1 |
| AI Citation Checker | 46 | 51 | +5 pts | 9% +2 pp | 6.9 −0.5 |
| Author Page Audit | 49 | 54 | +5 pts | 12% +4 pp | 3.4 −0.4 |
| Technical Site Audit (Crawler) | 60 | 64 | +4 pts | 35% +9 pp | 4.4 −0.2 |
| Meta Tag Analyzer | 80 | 83 | +3 pts | 59% +8 pp | 2.9 −0.4 |
| All-in-One SEO Audit | 73 | 75 | +2 pts | 38% +10 pp | 14.2 −0.9 |
| On-Page SEO Audit | 74 | 76 | +2 pts | 38% +7 pp | 10.6 −0.7 |
| AI Content Score | 63 | 64 | +1 pts | 10% no change | 6.0 −0.3 |
| Page Speed & Size Test | 90 | 90 | no change | 75% no change | 1.2 no change |
| E-E-A-T Analyzer | 38 | 38 | no change | 1% no change | 6.5 −0.3 |
| Thin Content Checker | 36 | 36 | no change | 25% +4 pp | 2.8 −0.2 |
| AEO Checker (Answer Engine Optimization) | 40 | 40 | no change | 2% +1 pp | 5.7 −0.3 |
| Local SEO Audit | 22 | 22 | no change | 1% no change | 6.0 −0.2 |
| Content Freshness Score | 13 | 13 | no change | 2% +1 pp | 4.2 −0.2 |
| AI FAQ Optimizer | 30 | 30 | no change | 2% +1 pp | 0.0 no change |
| Topical Authority Map | 47 | 47 | no change | 9% +1 pp | 2.9 −0.2 |
| Anchor Text Optimizer | 79 | 79 | no change | 43% −2 pp | 1.1 −0.1 |
| FAQ Gap Finder | 0 | 0 | no change | 3% +1 pp | 2.8 no change |
For both editions on one page, check by check, see the September 2026 vs October 2026 comparison.
October 2026, tool by tool
Each of the 25 tools in this edition has a page of its own for October 2026: its score distribution, the SeoMods checks that went unmet, and — where the tool was also measured in September 2026 — which checks moved. The figure on each card is that tool’s median for the month.
How the scores fell
This is how the SeoMods scores of the 6 main measures spread across the five bands in October 2026. Every row totals 100%; what matters is not the height of any one band but the shape of the spread. These 6 main measures are part of the 25 tools in this edition.
- 0–19
- 20–39
- 40–59
- 60–79
- 80–100
| Score band | All-in-One Audit | Page Speed | Mobile-Friendly | Meta Tags | AI Visibility | E-E-A-T |
|---|---|---|---|---|---|---|
| 0–19 | 0% · 0 | 0% · 3 | 5% · 174 | 5% · 206 | 8% · 310 | 20% · 744 |
| 20–39 | 0% · 15 | 2% · 65 | 5% · 200 | 9% · 338 | 13% · 480 | 34% · 1,310 |
| 40–59 | 20% · 827 | 6% · 232 | 1% · 45 | 11% · 405 | 17% · 660 | 31% · 1,176 |
| 60–79 | 42% · 1,719 | 17% · 671 | 29% · 1,090 | 16% · 616 | 33% · 1,255 | 14% · 544 |
| 80–100 | 38% · 1,545 | 75% · 2,867 | 60% · 2,219 | 59% · 2,259 | 29% · 1,098 | 1% · 24 |
| Total runs | 4,106 | 3,838 | 3,728 | 3,824 | 3,803 | 3,798 |
All 25 tools, ranked
The chart above shows the 6 main measures. The table below ranks all 25 tools in this edition — the 6 main measures included — by median SeoMods score; each reached at least 500 scans in October 2026. Reading: in this month’s sample the tools that measure checks about how a page is delivered mostly sit near the top, and the tools that measure content and AI visibility signals mostly sit near the bottom.
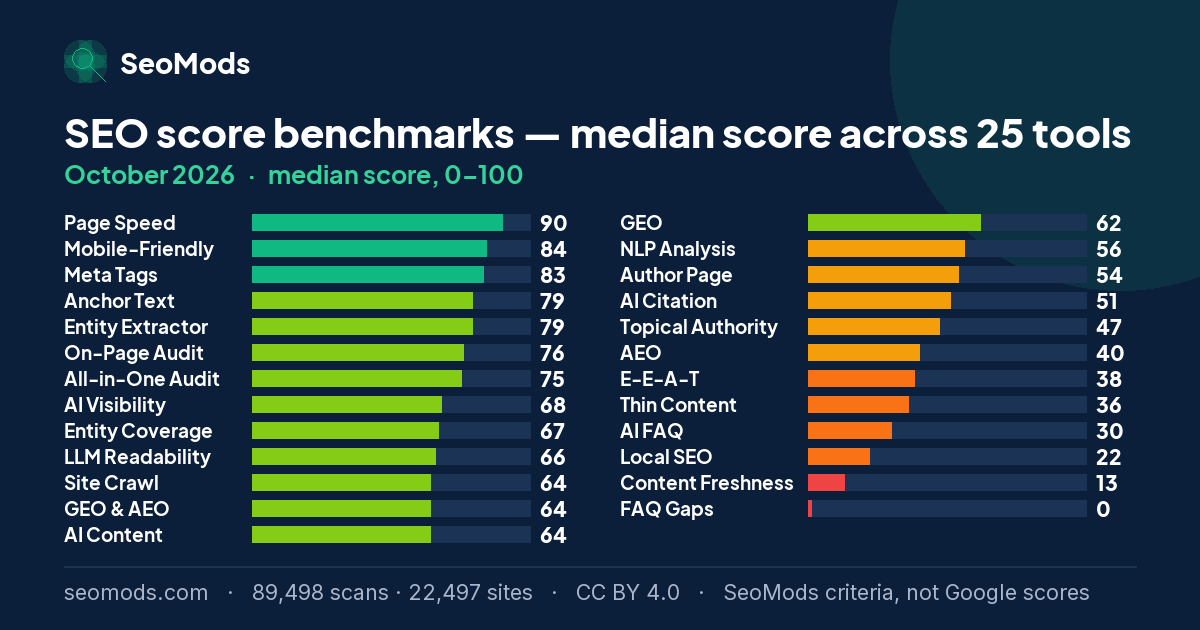
“Middle half” is the range the middle 50% of results fall into (25th–75th percentile). A narrow band means the tool scores most sites alike; a wide one means sites genuinely diverge on that measure.
The SeoMods checks most often unmet
The SeoMods checks that were not met in the full audits during October 2026. The rates follow SeoMods’ own criteria; they are not Google’s assessment of these pages. What each check means, and the category breakdown, live on that tool’s own benchmark page; the month’s full breakdown is on the audit’s October 2026 page.
On Page Speed
On Mobile-Friendly
On Meta Tags
On AI Visibility
On E-E-A-T
This month’s sample
In October 2026 the 25 tools in this edition recorded 89,498 successful scans across 22,497 unique domains in 48 countries. How the sample is collected, how it is anonymized and where its limits are is set out in the methodology on the hub — it governs the whole series, so it is stated there once. The table below shows the domain endings for the 6 main measures.
| Tool | Domain endings in the sample |
|---|---|
| All-in-One Audit | .com 48% · .org 8% · .uk 4% · .net 3% · other 37% |
| Page Speed | .com 46% · .org 10% · .uk 4% · .net 3% · other 37% |
| Mobile-Friendly | .com 46% · .org 9% · .uk 5% · .net 3% · other 37% |
| Meta Tags | .com 46% · .org 9% · .uk 5% · .de 3% · other 36% |
| AI Visibility | .com 48% · .org 9% · .uk 5% · .io 3% · other 35% |
| E-E-A-T | .com 47% · .org 9% · .uk 5% · .net 3% · other 36% |
What these scores do not measure
- It is not a Google ranking. A high score does not guarantee a better position, and a low one does not mean Google has penalised the page.
- It is not an organic traffic estimate. No click, impression or visit data goes into it.
- It is not Google’s E-E-A-T score. Google publishes no such score; E-E-A-T is a concept from its search quality rater guidelines.
- It is not a Google PageSpeed Insights score. Nothing here is run in a browser, and Core Web Vitals (LCP, INP, CLS) are not measured.
- It does not represent the whole of the real user experience. What is measured is one URL’s HTML and server response at the moment of the scan.
- It is not a direct measurement of the signals every AI system uses. Which system uses which signal, and how, is not public; the score measures the checks SeoMods chose.
About this benchmark. This benchmark is calculated from data on the sites SeoMods has scanned. The results do not necessarily represent all websites, or a random selection of them. The scores express SeoMods’ own measurement and scoring criteria; they are not ranking, quality, E-E-A-T or AI visibility scores issued by Google. Sample, anonymization and licence: the full methodology.
Frequently asked questions
What was the average SEO score in October 2026?
In October 2026 the All-in-One SEO Audit had a median of 75/100 and a mean of 72.6. 38% of scans reached 80 or above, while 20% landed in the 40–59 band. These figures are frozen and will not change.
Does this page ever change?
Its figures do not. A dated report is only useful if it stays put: someone citing the October 2026 numbers today has to find the same numbers at the same URL two years from now. The one thing added afterwards is a pointer to the next month’s edition once that is published — the data is left exactly as it was. For the running total across every published month, go to the benchmark hub; a new edition is published at the start of each month for the month that just ended.
Which SeoMods check went unmet most often in October 2026?
On the full audit, “Author & date (E-E-A-T)”, not met in 83% of audits, followed by “llms.txt present” (79%) and “Healthy text-to-HTML ratio” (74%). On AI visibility the check most often unmet was “llms.txt present” at 79%. On meta tags it was “Title length (30–60)” at 53%.
Did SEO scores rise or fall compared with September 2026?
Set against September 2026, 12 of the 25 tools had a higher median, 10 the same and 3 a lower one. The largest fall was on the NLP Content Analyzer (65 → 56) and the largest rise on the Entity Extractor (58 → 79). The two samples are close in size, but they are not the same set of sites. The difference should not be read as sites having improved or got worse: a different mix of sites can move a median and a distribution by itself.
Citing this edition
The figures on this page are free to reuse under CC BY 4.0. Suggested citation: SeoMods — SEO Score Benchmarks, October 2026 edition, https://seomods.com/seo-score-benchmarks/october-2026.