
Generative Engine Optimization is the widest of the AI-readiness checks: it looks at the whole path from a crawler being allowed in to a passage being safe to repeat. Scores land in the middle of the dataset rather than at the bottom, which is a slightly encouraging result — most sites already satisfy the technical half of the requirement without knowing it. What they miss is the editorial half.
Here is where that sits. The median SeoMods score is 56/100, which ranks it 14 of the 25 tools with a published benchmark by median. The ranking runs over the 25 tools on the main benchmark page; 1st is the highest median. The middle half of results falls between 32 and 74 — a band 42 points wide. That is wide: in this sample sites’ scores diverge markedly on this measure.
How the scores are distributed
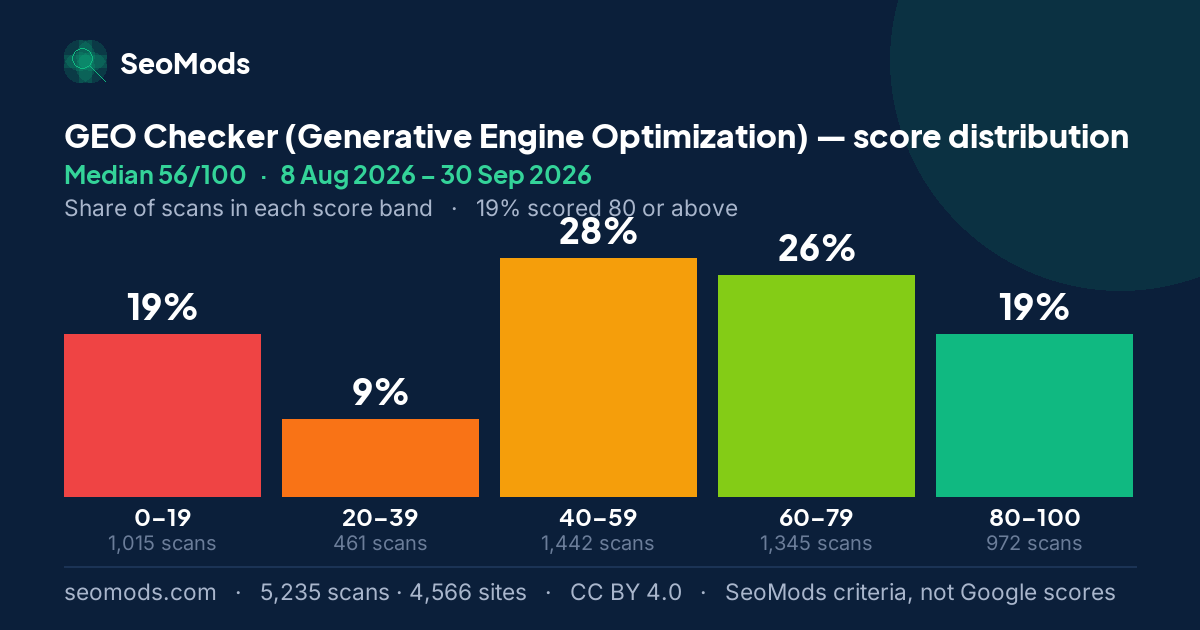
An average on its own misleads. The chart below splits all 5,235 scans into five score bands, totalling 100%. The spread is wide and fairly even: in this sample sites land at very different levels on this measure.
- 0–19
- 20–39
- 40–59
- 60–79
- 80–100
| Score band | GEO |
|---|---|
| 0–19 | 19% · 1,015 |
| 20–39 | 9% · 461 |
| 40–59 | 28% · 1,442 |
| 60–79 | 26% · 1,345 |
| 80–100 | 19% · 972 |
| Total runs | 5,235 |
The grade mix
The same data as letters: A+ 95–100, A 85–94, B 75–84, C 65–74, D 50–64 and F below 50.
Where does my score sit?
A mid-range score here usually means the plumbing is fine and the provenance is not. That is a useful thing to learn, because the two halves have very different costs: the technical checks are configuration you do once, and the editorial ones are a standing commitment to say who wrote a thing and when. The upper quartile is where both halves are being done.
| Tool | P10 | P25 | Median | P75 | P90 | Mean | Lowest | Highest |
|---|---|---|---|---|---|---|---|---|
| GEO | 12 | 32 | 56 | 74 | 88 | 52.9 | 0 | 100 |
A score from the GEO Checker (Generative Engine Optimization) can be read against the five values below. All of them are calculated from the scans in this benchmark: they place a SeoMods score within this sample, not in Google’s results.
| Percentile | Score | What it means for a score |
|---|---|---|
| P10 | 12 | About one scan in ten scored 12 or lower. Below it, a page is in the lowest tenth of this sample. |
| P25 | 32 | The edge of the bottom quarter. A score under 32 is below about three quarters of the scans. |
| Median | 56 | The middle of the sample: half the scans scored lower, half higher. A score of 56 is the typical result here. |
| P75 | 74 | Where the top quarter begins. A score of 74 or more is at or above about three quarters of the scans. |
| P90 | 88 | Where the top tenth begins. A score of 88 or more is among the highest 10% of scans in this sample. |
Percentiles describe the sites SeoMods scanned, not the whole web, and they apply to this tool only: the same number on another tool sits somewhere else.
The SeoMods checks most often unmet
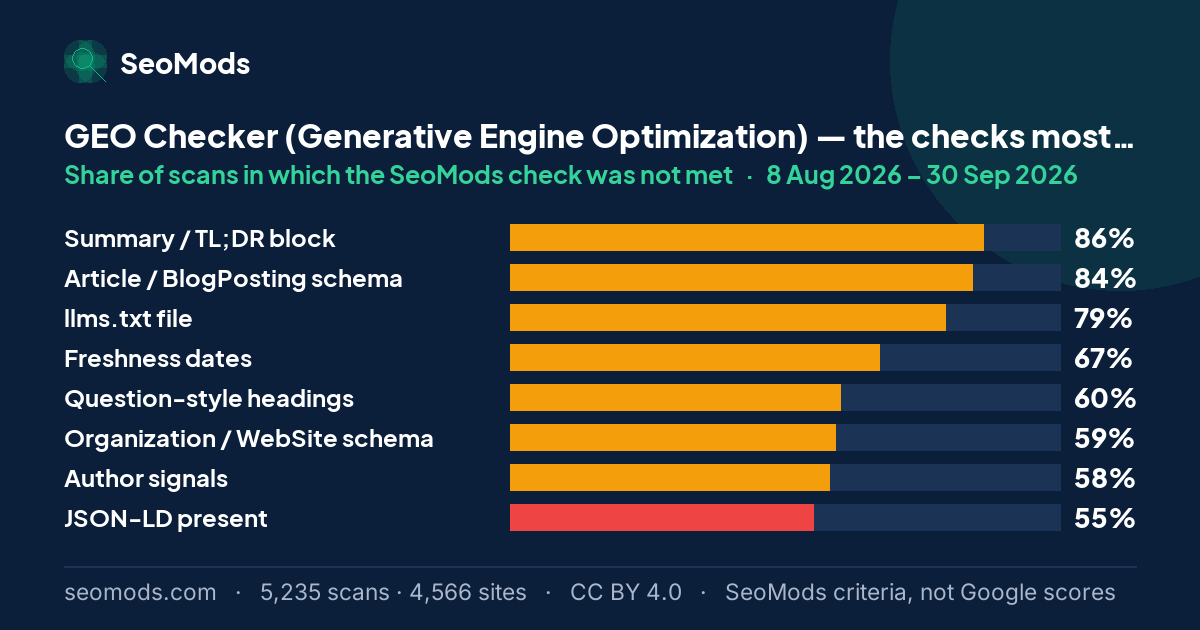
Read the failing checks as two columns even though they are shown as one list. Crawl access, server-side rendering and JSON-LD are the machine half — they decide whether the page can be processed at all. Author signals, dates, sources and summary blocks are the human half — they decide whether processing it produces something an engine is willing to repeat.
| Check | Not met (share of scans) | Weight |
|---|---|---|
| Summary / TL;DR block | 86% | Partial |
| Article / BlogPosting schema | 84% | Partial |
| llms.txt file | 79% | Partial |
| Freshness dates | 67% | Partial |
| Question-style headings | 60% | Partial |
| Organization / WebSite schema | 59% | Partial |
| Author signals | 58% | Partial |
| JSON-LD present | 55% | Hard fail |
| Comprehensive coverage | 39% | Partial |
| Server-rendered content | 30% | Hard fail |
| Lists / tables | 27% | Partial |
| Outbound citations | 26% | Partial |
The rate is the share of scans in which a SeoMods check was not met. It is SeoMods’ criterion, not Google’s assessment of these pages. “Hard fail” means the check’s full weight is deducted from the SeoMods score; “partial” means part of it.
The weakest areas
This tool groups its checks into categories. The chart below shows how often each category was the lowest-scoring one in a scan — which area is most often the weak link. It is not the average score in that category; it is how often it came last.
“Structured data” was the weakest area in 62% of scans.
What to fix first
Confirm the page renders its content server-side before anything else, because a page whose text only exists after JavaScript runs fails every subsequent check for a reason that has nothing to do with the writing. Once the text is genuinely in the HTML, the dates and author line are the fastest remaining wins.
A typical scan passes 7.6 of 15 checks and leaves 7.4 open items behind. In this sample what brings a SeoMods score down is mostly not one large omission but accumulated small ones.
Run the GEO Checker (Generative Engine Optimization) on your own page
Month by month
This page adds every published month together. Underneath it, each month is frozen as an edition of its own whose figures are never edited again — which is the only reason two months can be set side by side at all. Below is the GEO Checker (Generative Engine Optimization) across the 2 published editions, with the combined figure in the last row of the table.
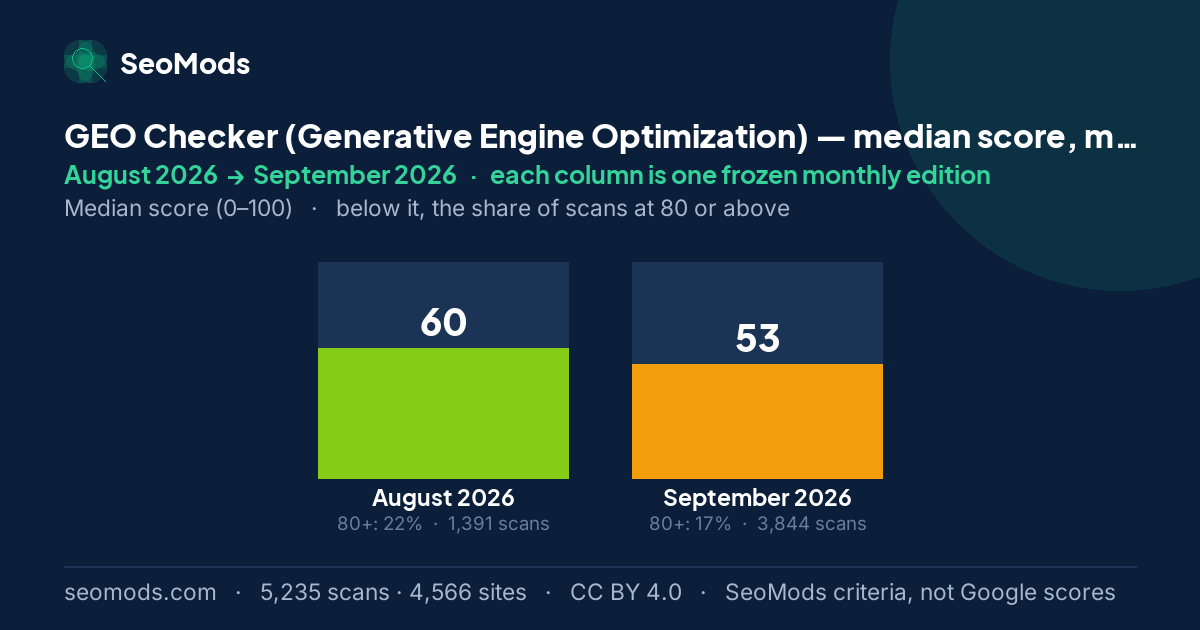
Between August 2026 and September 2026 the median went from 60 to 53, and the share of scans at 80 or above went from 22% to 17%. The two months do not measure the same sites — the September 2026 sample has about 3 times as many sites — so read the gap as a change in the cross-section measured, not as the same sites getting better or worse.
| Edition | Median | vs. previous | Scored 80+ | Issues/run | Runs |
|---|---|---|---|---|---|
| August 2026 | 60 | baseline | 22% | 7.2 | 1,391 |
| September 2026 | 53 | −7 pts | 17% | 7.5 | 3,844 |
| All published months, combined | 56 | — | 19% | 7.4 | 5,235 |
Reading a monthly difference. Each month is a separate sample, and its size changes from month to month. A change in sample size can move a median and a distribution by itself, so a monthly difference should not be mistaken for a change in scores: it does not show that sites improved or got worse.
Which checks moved
Each check’s rate in the first edition that measured it, beside its rate in the latest. Moves under two points are marked as no change: these are independent monthly samples of a shifting set of sites, and a difference that small is not evidence that anything on the web changed.
| Check | Not met in August 2026 | Not met in September 2026 | Change |
|---|---|---|---|
| llms.txt file | 71% · August 2026 | 82% · September 2026 | +11 pp |
| Organization / WebSite schema | 52% · August 2026 | 62% · September 2026 | +10 pp |
| JSON-LD present Hard fail | 48% · August 2026 | 58% · September 2026 | +10 pp |
| Author signals | 61% · August 2026 | 57% · September 2026 | −4 pp |
| Question-style headings | 57% · August 2026 | 61% · September 2026 | +4 pp |
| Server-rendered content Hard fail | 33% · August 2026 | 29% · September 2026 | −4 pp |
| Summary / TL;DR block | 88% · August 2026 | 85% · September 2026 | −3 pp |
| Lists / tables | 29% · August 2026 | 26% · September 2026 | −3 pp |
| Freshness dates | 66% · August 2026 | 68% · September 2026 | no change |
| Comprehensive coverage | 38% · August 2026 | 40% · September 2026 | no change |
| Article / BlogPosting schema | 84% · August 2026 | 85% · September 2026 | no change |
What this score does not measure
- It is not a direct measurement of the signals every AI system uses. Which system uses which signal, and how, is not public; the score measures the checks SeoMods chose.
- It does not measure whether a page is actually cited in AI answers. It measures readiness on the page, not what any assistant returned.
- It is not a Google ranking. A high score does not guarantee a better position, and a low one does not mean Google has penalised the page.
About this benchmark. This benchmark is calculated from data on the sites SeoMods has scanned. The results do not necessarily represent all websites, or a random selection of them. The scores express SeoMods’ own measurement and scoring criteria; they are not ranking, quality, E-E-A-T or AI visibility scores issued by Google. Sample, anonymization and licence: the full methodology.
Frequently asked questions
What is GEO and how is it different from AEO?
GEO covers the whole readiness path for generative engines — access, rendering, structure, freshness and provenance. AEO is a subset of it concerned specifically with formatting an answer so it can be extracted. A page can be perfectly formatted for extraction and still invisible to a generative engine because a robots rule blocks the crawler.
Does client-side rendering really stop AI engines?
It varies by engine and it is unwise to rely on any of them. Some fetchers execute JavaScript, several do not, and the ones that do often have shorter budgets than a search crawler. Content that only exists after hydration is at best inconsistently visible; content in the initial HTML is visible to everything.
How current does a page have to be?
It depends entirely on the subject. For a definition or a how-to, a date from several years ago is not a problem and may be a sign of stability. For anything about tooling, pricing, algorithms or the law, an old date is a reason to prefer somebody else's page. What consistently hurts is having no date at all, because then nothing on the page indicates how current it is.
What is a good score on the GEO Checker (Generative Engine Optimization)?
In this dataset the median SeoMods score is 56/100, so scoring 56 sits exactly in the middle of the sample. 74 is the start of the upper quartile and 88 or above is the top 10%; below 32 is the bottom quarter. Those thresholds are specific to this tool — the 25 tools with a published benchmark have very different medians, so 70 here and 70 elsewhere do not mean the same thing. They place a page among the sites SeoMods scanned; they say nothing about Google rankings.
Is the score from the GEO Checker (Generative Engine Optimization) issued by Google?
No. It is a benchmark score calculated against the check list SeoMods defined for this tool. A SeoMods check going unmet does not mean Google has penalised the page or ranked it lower.
Which SeoMods check goes unmet most often on the GEO Checker (Generative Engine Optimization)?
“Summary / TL;DR block”, which was not met in 86% of scans. The largest losses on the SeoMods score, though, come from the checks scored as hard fails — this tool has 2, the most common being “JSON-LD present” at 55%.
Questions that govern the whole series — how the sample is collected, how sites are anonymized, how often the figures are refreshed — are answered in the methodology on the hub.
Using this data
The figures, tables and charts on this page are free to reuse under CC BY 4.0; the only condition is a link back to this page. Suggested citation: SeoMods — GEO Checker (Generative Engine Optimization) benchmarks, 2 October 2026, https://seomods.com/seo-score-benchmarks/geo-checker. If you need to cite by date, use the September 2026 edition instead: this page changes at every refresh and that one never does.