
The On-Page SEO Audit is the narrower sibling of the full audit: same page, but only the things that live in the HTML you control. No crawling, no site-wide inference, no external signals. That focus is what makes it useful as a working checklist rather than a diagnosis — everything it reports is something you can change in the page source and re-run in a minute.
Here is where that sits. The median SeoMods score is 77/100, which ranks it 6 of the 25 tools with a published benchmark by median. The ranking runs over the 25 tools on the main benchmark page; 1st is the highest median. The middle half of results falls between 63 and 85 — a band 22 points wide. That is wide: in this sample sites’ scores diverge markedly on this measure.
How the scores are distributed
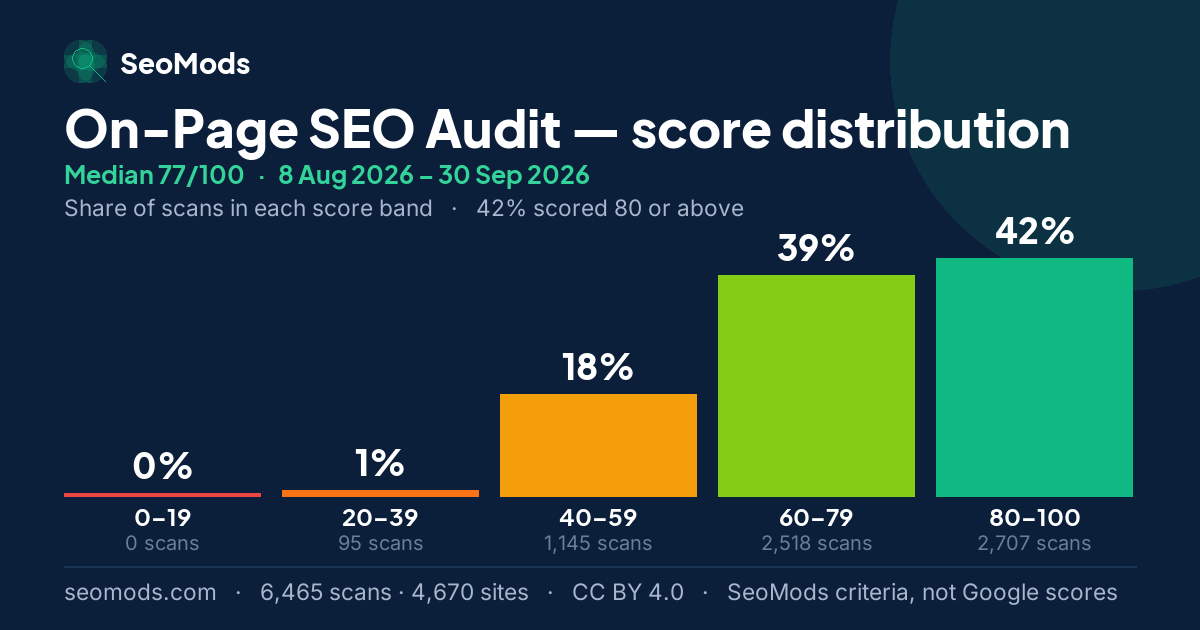
An average on its own misleads. The chart below splits all 6,465 scans into five score bands, totalling 100%. Most results sit in the middle bands, which means sites differ here by degree rather than by whether they bothered at all.
- 0–19
- 20–39
- 40–59
- 60–79
- 80–100
| Score band | On-Page Audit |
|---|---|
| 0–19 | 0% · 0 |
| 20–39 | 1% · 95 |
| 40–59 | 18% · 1,145 |
| 60–79 | 39% · 2,518 |
| 80–100 | 42% · 2,707 |
| Total runs | 6,465 |
The grade mix
The same data as letters: A+ 95–100, A 85–94, B 75–84, C 65–74, D 50–64 and F below 50.
Where does my score sit?
Read this score as "how much of the page did I actually fill in". It rewards completeness over cleverness: a plain page with a good title, one H1, real headings, ALT text and a description scores well, while an elaborate page missing three of those does not. The upper quartile is reachable by anybody willing to go through the list once.
| Tool | P10 | P25 | Median | P75 | P90 | Mean | Lowest | Highest |
|---|---|---|---|---|---|---|---|---|
| On-Page Audit | 50 | 63 | 77 | 85 | 91 | 73.8 | 27 | 100 |
A score from the On-Page SEO Audit can be read against the five values below. All of them are calculated from the scans in this benchmark: they place a SeoMods score within this sample, not in Google’s results.
| Percentile | Score | What it means for a score |
|---|---|---|
| P10 | 50 | About one scan in ten scored 50 or lower. Below it, a page is in the lowest tenth of this sample. |
| P25 | 63 | The edge of the bottom quarter. A score under 63 is below about three quarters of the scans. |
| Median | 77 | The middle of the sample: half the scans scored lower, half higher. A score of 77 is the typical result here. |
| P75 | 85 | Where the top quarter begins. A score of 85 or more is at or above about three quarters of the scans. |
| P90 | 91 | Where the top tenth begins. A score of 91 or more is among the highest 10% of scans in this sample. |
Percentiles describe the sites SeoMods scanned, not the whole web, and they apply to this tool only: the same number on another tool sits somewhere else.
The SeoMods checks most often unmet
What fails here is overwhelmingly the writing rather than the engineering. Titles outside their range, headings that skip a level, images without ALT text, descriptions that were never written — none of it requires a developer, and all of it requires somebody to care about a page after it has been published.
| Check | Not met (share of scans) | Weight |
|---|---|---|
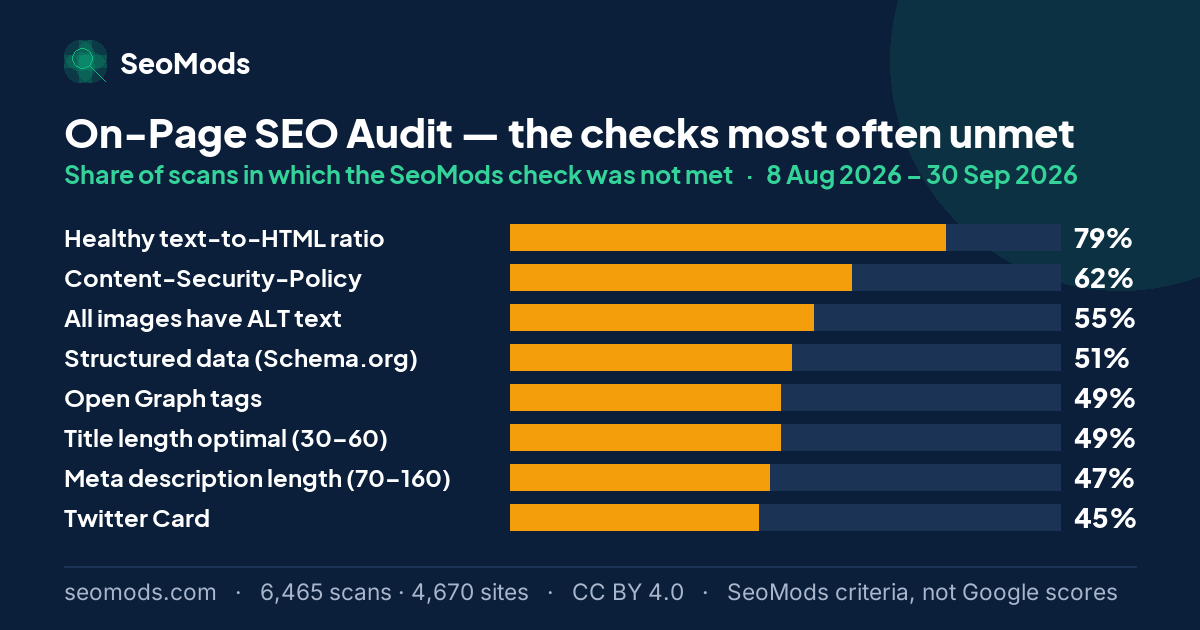
| Healthy text-to-HTML ratio | 79% | Partial |
| Content-Security-Policy | 62% | Partial |
| All images have ALT text | 55% | Partial |
| Structured data (Schema.org) | 51% | Partial |
| Open Graph tags | 49% | Partial |
| Title length optimal (30–60) | 49% | Partial |
| Meta description length (70–160) | 47% | Partial |
| Twitter Card | 45% | Partial |
| HSTS header | 44% | Partial |
| X-Content-Type-Options | 43% | Partial |
| Exactly one H1 | 42% | Partial |
| Limited inline styles | 39% | Partial |
The rate is the share of scans in which a SeoMods check was not met. It is SeoMods’ criterion, not Google’s assessment of these pages. “Hard fail” means the check’s full weight is deducted from the SeoMods score; “partial” means part of it.
The weakest areas
This tool groups its checks into categories. The chart below shows how often each category was the lowest-scoring one in a scan — which area is most often the weak link. It is not the average score in that category; it is how often it came last.
“Social & structured data” was the weakest area in 44% of scans.
What to fix first
Work down the list by weight, not by order, and do the headings before the meta. Heading structure is the thing everything else hangs off: it tells a crawler and a language model how the page is organised, and fixing it usually surfaces content problems the meta tags were papering over.
A typical scan passes 25.9 of 36 checks and leaves 10.1 open items behind. In this sample what brings a SeoMods score down is mostly not one large omission but accumulated small ones.
Run the On-Page SEO Audit on your own page
Month by month
This page adds every published month together. Underneath it, each month is frozen as an edition of its own whose figures are never edited again — which is the only reason two months can be set side by side at all. Below is the On-Page SEO Audit across the 2 published editions, with the combined figure in the last row of the table.
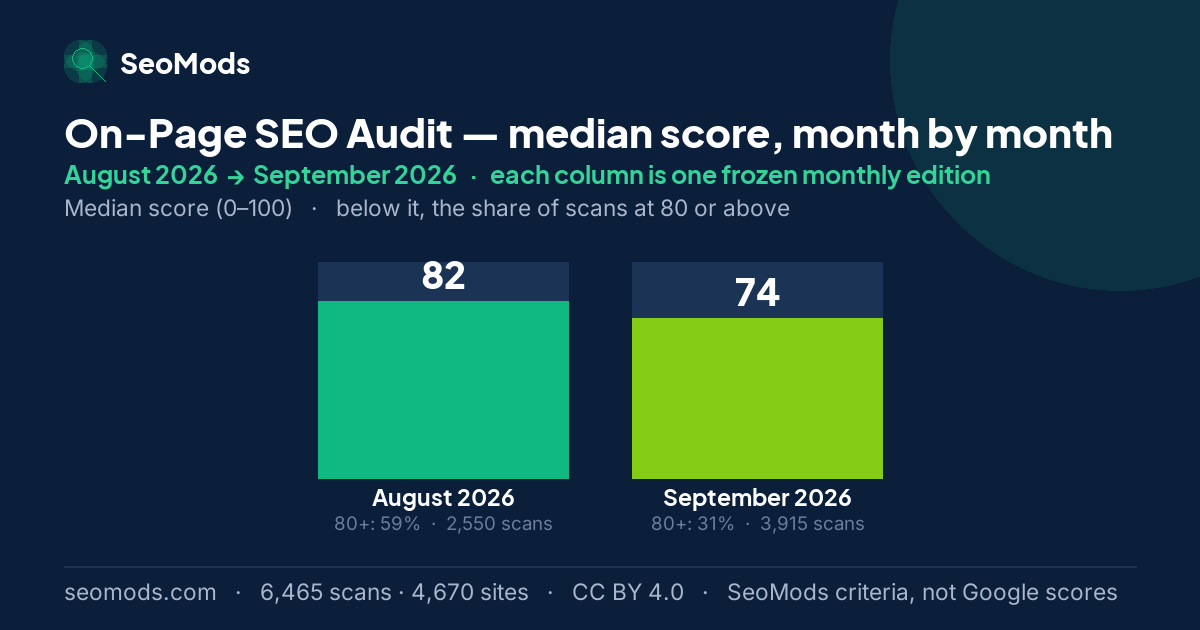
Between August 2026 and September 2026 the median went from 82 to 74, and the share of scans at 80 or above went from 59% to 31%. The two months do not measure the same sites — the September 2026 sample has about 3 times as many sites — so read the gap as a change in the cross-section measured, not as the same sites getting better or worse.
| Edition | Median | vs. previous | Scored 80+ | Issues/run | Runs |
|---|---|---|---|---|---|
| August 2026 | 82 | baseline | 59% | 8.3 | 2,550 |
| September 2026 | 74 | −8 pts | 31% | 11.3 | 3,915 |
| All published months, combined | 77 | — | 42% | 10.1 | 6,465 |
Reading a monthly difference. Each month is a separate sample, and its size changes from month to month. A change in sample size can move a median and a distribution by itself, so a monthly difference should not be mistaken for a change in scores: it does not show that sites improved or got worse.
Which checks moved
Each check’s rate in the first edition that measured it, beside its rate in the latest. Moves under two points are marked as no change: these are independent monthly samples of a shifting set of sites, and a difference that small is not evidence that anything on the web changed.
| Check | Not met in August 2026 | Not met in September 2026 | Change |
|---|---|---|---|
| Content-Security-Policy | 47% · August 2026 | 71% · September 2026 | +24 pp |
| Structured data (Schema.org) | 37% · August 2026 | 60% · September 2026 | +23 pp |
| Open Graph tags | 35% · August 2026 | 58% · September 2026 | +23 pp |
| All images have ALT text | 45% · August 2026 | 62% · September 2026 | +17 pp |
| Meta description length (70–160) | 37% · August 2026 | 54% · September 2026 | +17 pp |
| Exactly one H1 | 33% · August 2026 | 47% · September 2026 | +14 pp |
| Title length optimal (30–60) | 41% · August 2026 | 54% · September 2026 | +13 pp |
| X-Content-Type-Options | 35% · August 2026 | 47% · September 2026 | +12 pp |
| Clickjacking protection | 32% · August 2026 | 43% · September 2026 | +11 pp |
| Healthy text-to-HTML ratio | 78% · August 2026 | 80% · September 2026 | no change |
What this score does not measure
- It is not a Google ranking. A high score does not guarantee a better position, and a low one does not mean Google has penalised the page.
- It is not an organic traffic estimate. No click, impression or visit data goes into it.
- It does not represent the whole of the real user experience. What is measured is one URL’s HTML and server response at the moment of the scan.
About this benchmark. This benchmark is calculated from data on the sites SeoMods has scanned. The results do not necessarily represent all websites, or a random selection of them. The scores express SeoMods’ own measurement and scoring criteria; they are not ranking, quality, E-E-A-T or AI visibility scores issued by Google. Sample, anonymization and licence: the full methodology.
Frequently asked questions
How is this different from the All-in-One audit?
The All-in-One audit adds the technical and delivery layers — security headers, redirects, compression, mobile layout, AI readiness — and produces one combined score. This one stays inside on-page SEO: what is in the HTML, how it is structured, and whether the writing is complete. Use this when you are editing a page and the other when you are assessing it.
Should every page have exactly one H1?
Yes in practice, even though HTML5 technically permits more. One H1 states unambiguously what the page is about; several make a crawler guess, and guessing is not in your favour. The common failure is a theme that renders the site logo as an H1 on every page, which quietly turns your brand name into every page's topic.
How much content does a page need to pass?
There is no threshold that guarantees anything, but pages under a few hundred words rarely have room to answer a question completely, and the check flags them for that reason rather than because length is a ranking factor. Depth is what is really being measured; word count is just the proxy that can be measured automatically.
What is a good score on the On-Page SEO Audit?
In this dataset the median SeoMods score is 77/100, so scoring 77 sits exactly in the middle of the sample. 85 is the start of the upper quartile and 91 or above is the top 10%; below 63 is the bottom quarter. Those thresholds are specific to this tool — the 25 tools with a published benchmark have very different medians, so 70 here and 70 elsewhere do not mean the same thing. They place a page among the sites SeoMods scanned; they say nothing about Google rankings.
Is the score from the On-Page SEO Audit issued by Google?
No. It is a benchmark score calculated against the check list SeoMods defined for this tool. A SeoMods check going unmet does not mean Google has penalised the page or ranked it lower.
Which SeoMods check goes unmet most often on the On-Page SEO Audit?
“Healthy text-to-HTML ratio”, which was not met in 79% of scans. None of this tool's checks are scored as hard fails; every one of them loses partial credit instead.
Questions that govern the whole series — how the sample is collected, how sites are anonymized, how often the figures are refreshed — are answered in the methodology on the hub.
Using this data
The figures, tables and charts on this page are free to reuse under CC BY 4.0; the only condition is a link back to this page. Suggested citation: SeoMods — On-Page SEO Audit benchmarks, 2 October 2026, https://seomods.com/seo-score-benchmarks/seo-audit. If you need to cite by date, use the September 2026 edition instead: this page changes at every refresh and that one never does.