How it works
- Enter a URL. The tool queries the CrUX API for that exact page first.
- If the page has no data of its own, it falls back to the whole origin and tells you which level was used.
- It adds weekly p75 trend charts from the CrUX History API. When CrUX has no data or is not configured, it uses PageSpeed Insights instead: field data when available, otherwise Lighthouse lab metrics marked with a "Lab data" badge.
- Results appear in Mobile and Desktop tabs, each with a PASSED or FAILED badge, per-metric values and fix suggestions. Results are cached for 12 hours.
What it checks
- LCP (Largest Contentful Paint) — when the main content appears. Good at 2.5 s or less, poor above 4 s.
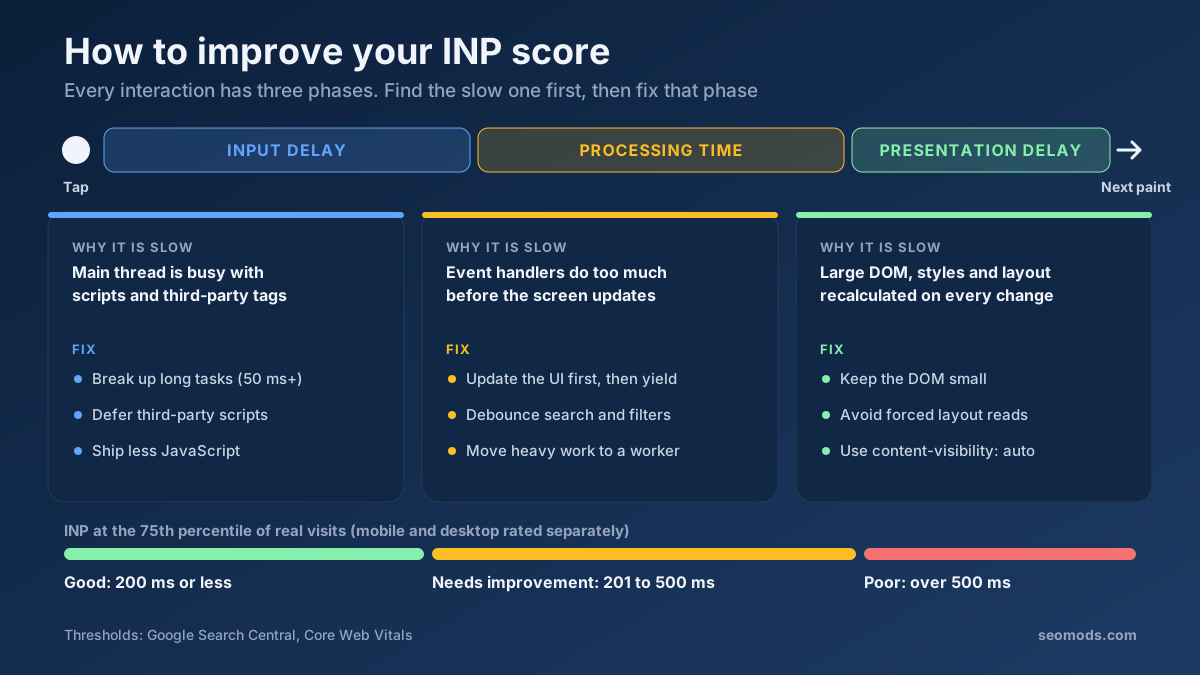
- INP (Interaction to Next Paint) — how quickly the page responds to taps, clicks and key presses. Good at 200 ms or less, poor above 500 ms.
- CLS (Cumulative Layout Shift) — how much the layout jumps while loading. Good at 0.1 or less, poor above 0.25.
- FCP (First Contentful Paint) — when the first text or image is drawn. Good at 1.8 s or less, poor above 3 s.
- TTFB (Time to First Byte) — how long the server takes to start responding. Good at 0.8 s or less, poor above 1.8 s.
- Distribution — a bar showing the share of visits rated good, needs improvement and poor for each metric, plus the collection period dates.
- Trends — weekly p75 history, showing whether a change is recent.
- Competitor comparison — up to three other origins side by side.
- Missing metrics — flagged clearly instead of being counted as passed.
Why it matters
Core Web Vitals describe loading speed, responsiveness and visual stability as real visitors experience them. Lab tests simulate one load on one machine; field data reflects the phones and networks your audience actually uses. The thresholds above are the published Core Web Vitals ranges — see Web Vitals on web.dev — and our PASSED or FAILED badge applies them to the p75 values. Good scores are one part of page experience; they do not guarantee better rankings on their own. Many sites with little traffic have no CrUX data at all, because Chrome only publishes data once enough users have visited; in that case the tool tells you and falls back to PageSpeed Insights.
How to fix common problems
For slow LCP, find the largest element above the fold, serve it at the right size in a modern format, preload it and avoid lazy-loading it. A high TTFB points to the server: add caching, reduce database work or move closer to your visitors. For poor INP, break up long JavaScript tasks, remove unused scripts and defer third-party tags. For CLS, give images, ads and embeds fixed dimensions and avoid inserting content above what is already visible. The Page Speed & Size Test tool measures load time and page size in a lab test, useful for checking a fix before field data catches up; the Gzip / Brotli Compression Test and Mobile-Friendly Checker tools cover compression and mobile layout.
Frequently asked questions
Why does my site have no Core Web Vitals data?
The Chrome UX Report only includes pages and origins with enough real Chrome visits in the period. Sites with little traffic often have no data at URL or origin level. When that happens, the tool falls back to PageSpeed Insights and, if no field data exists there either, shows Lighthouse lab metrics with a "Lab data" badge.
What is the difference between field data and lab data?
Field data comes from real Chrome users on their own devices and networks, summarised at the 75th percentile over 28 days. Lab data is a single simulated page load under fixed conditions. Lab data helps you debug, but it can differ from what visitors experience, so the tool labels it clearly.
Why is the assessment based on LCP, INP and CLS only?
Those three are the Core Web Vitals. FCP and TTFB are shown because they help explain a slow LCP, but they do not decide the result. The badge reads PASSED only when all three core metrics are good at p75; otherwise it reads FAILED, and missing metrics are flagged.
What does p75 mean?
The 75th percentile is the value that three out of four visits meet or beat. Using p75 instead of an average means a page has to work well for most visitors, not just the fastest ones.
Why are the URL results different from the origin results?
URL-level data describes one page, while origin-level data combines all pages on the site. If a page has too few visits for its own record, the tool uses origin data and shows that it did. A heavy page can then look better or worse than the site average.
How long until my fixes show up?
CrUX reports a rolling 28-day window, so a fix appears gradually as new visits replace old ones. The weekly trend charts help you watch the change. Results in this tool are also cached for 12 hours, so a rerun on the same day may show the same figures.