
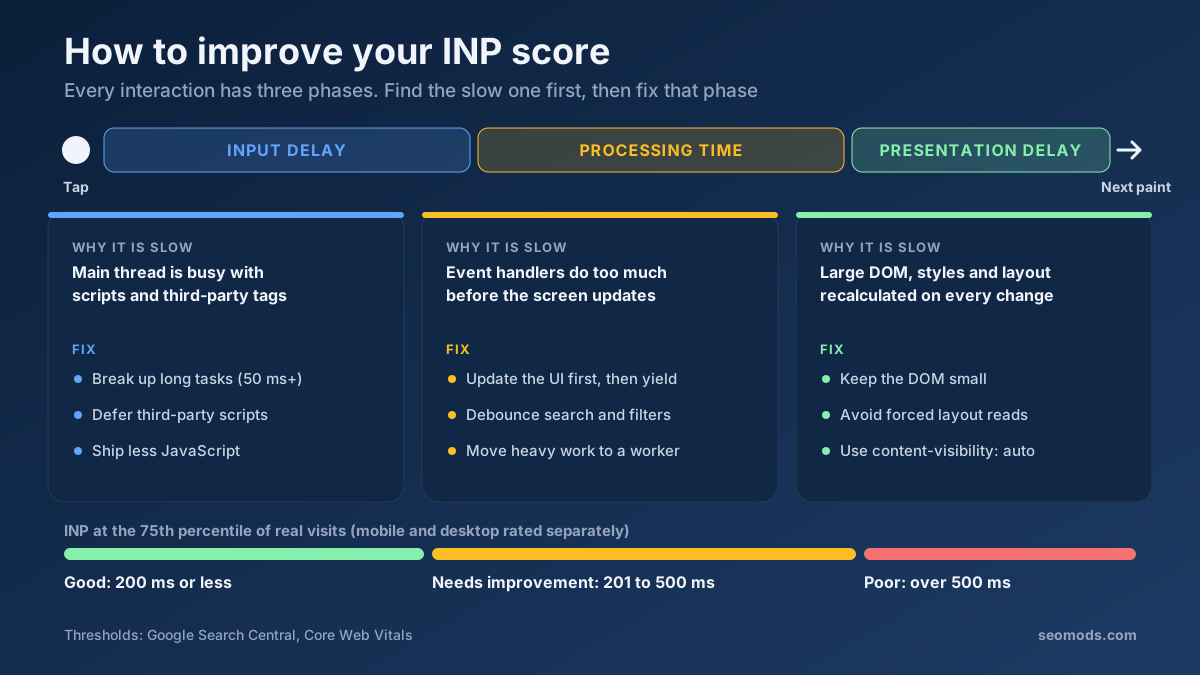
Short answer: To improve your INP score, find the slowest interaction on the page, then shorten whichever of its three phases is slow: input delay, processing time or presentation delay. In practice that means breaking up long JavaScript tasks, deferring or removing heavy third-party scripts, doing less work in event handlers and keeping the DOM small. A good INP is 200 ms or less.
Interaction to Next Paint is the Core Web Vital most sites fail without knowing why. Your page can load in a second and still feel sluggish, because INP does not care how fast the page appears. It measures how quickly the page reacts when someone taps a menu, opens a filter or types into a search box. This guide walks through ten fixes in the order we apply them, shows how to find the interaction that is actually dragging your score down, and shares what happened when our own mobile INP crossed the 200 ms line in November 2026.
What is Interaction to Next Paint (INP)?
Interaction to Next Paint is a responsiveness metric. Every time a visitor clicks, taps or presses a key, the browser has to run the code attached to that action and then paint the result on screen. INP records how long that takes, from the moment of input to the next frame the visitor can see. Google’s INP documentation on web.dev describes it as an observation of the latency of all qualifying interactions during a visit, with the final value being one of the longest.
A few details shape how you should read the number:
- Only clicks, taps and key presses count. Scrolling, hovering and pinch-zooming are not interactions for INP, even though a janky scroll still annoys people.
- The worst interaction usually decides the score. On pages with many interactions, the browser ignores one outlier for every 50 interactions, so a single freak delay on a long session does not ruin the result.
- The value is measured on real visits. The INP that counts for Core Web Vitals comes from Chrome users, reported at the 75th percentile and split between mobile and desktop.
That last point is the one people miss. If 75 percent of your mobile visits respond within 200 ms, you pass. If the slowest quarter of visits come from mid-range Android phones that struggle with your JavaScript, you fail, even if every test on your laptop looks perfect.
INP thresholds: good, needs improvement and poor
| INP at the 75th percentile | Rating | What visitors notice |
|---|---|---|
| 200 ms or less | Good | Taps feel instant. Menus and buttons respond before the finger lifts |
| 201 to 500 ms | Needs improvement | A short but noticeable lag, often followed by a second tap |
| More than 500 ms | Poor | The page seems frozen. Visitors tap again, rage-click or leave |
These are the thresholds Google publishes for Core Web Vitals in Search. They are the same for every type of site, which is useful: an online shop and a blog are held to one standard, so you always know where the line is.
INP vs FID: what changed
INP replaced First Input Delay as a Core Web Vital on 12 March 2024. The switch made life harder for many sites, and the reason is simple. FID measured only the first interaction, and only its waiting time before the code started running. INP measures every interaction, and it includes the time to run the code and draw the next frame.
| First Input Delay (retired) | Interaction to Next Paint | |
|---|---|---|
| Which interactions | Only the first one | All clicks, taps and key presses during the visit |
| What is timed | Waiting time before handlers start | Waiting, handler processing and rendering until the next paint |
| Good threshold | 100 ms or less | 200 ms or less |
| Typical blind spot | Slow menus, filters and forms used later in the visit | None of these. That is why scores dropped |
A site that passed FID comfortably could still have a filter panel that takes 600 ms to update. FID never saw it. INP does.
The three phases of every interaction
Every slow interaction is slow for one of three reasons, and each needs a different fix. Before you change any code, work out which phase is the problem. Guessing here is how teams spend a week optimizing images when the real culprit is a chat widget.
- Input delay is the time between the tap and the moment your event handler starts. If the main thread is busy running something else, such as a script that is still parsing or an analytics tag that fires every few seconds, the tap has to wait in line.
- Processing time is how long your event handlers take to run. A click handler that filters 2,000 products, rebuilds a list and sends three tracking events all before returning is a classic example.
- Presentation delay is the time the browser needs to recalculate styles, lay out the page and paint the new frame. Large DOMs, complex CSS selectors and layout changes that touch the whole page make this phase long.
As a rough rule from the audits we run, input delay dominates on content sites full of third-party tags, processing time dominates on web apps and shops with heavy client-side logic, and presentation delay dominates on very long pages, such as category pages that render hundreds of product cards at once.
How to measure INP before you fix anything
You need two kinds of data. Field data tells you whether you have a problem and how big it is. Lab data tells you why. Skipping either one leads to bad decisions.
Field data: what real visitors experience
Start with the Core Web Vitals Checker. Enter a URL and it shows the 75th-percentile INP from the Chrome UX Report for mobile and desktop, the share of visits rated good, needs improvement and poor, and how the value has moved week by week. If the URL has too little traffic for its own data, it falls back to the origin, which is the whole site.
Then open the Core Web Vitals report in Search Console. It groups similar URLs, so an issue such as “INP issue: longer than 200ms (mobile)” usually points to one template, for example every product page, rather than to individual pages. Our guide to measuring SEO in Search Console explains how to read those groups.
Field data has one limitation: it is a 28-day rolling window. A fix you ship today will take up to four weeks to be fully reflected, so do not panic if the number barely moves after a few days.
Lab data: why the page is slow
Lab tools cannot measure INP directly, because there is no real person tapping. They offer close proxies instead:
- Total Blocking Time (TBT) in Lighthouse and PageSpeed Insights adds up the parts of long tasks that block the main thread during load. A high TBT almost always means high input delay for early taps.
- The Performance panel in Chrome DevTools shows live INP as you click around, and a recorded trace breaks each interaction into the three phases. Turn on CPU throttling (4x or 6x slowdown) so your fast laptop behaves more like a mid-range phone.
- The web-vitals JavaScript library with its attribution build reports, for each slow interaction, which element was clicked, how long each phase took and which script was running. Sending that to your analytics turns “INP is bad” into “the size filter on category pages takes 480 ms on Android”.
The Page Speed & Size Test is a quick way to check how heavy a page is before you profile it. Pages that ship several megabytes of JavaScript are nearly always the ones with INP trouble.
A lab test on a real category page
Here is a typical pattern. On a mid-sized shop’s category page, recorded in DevTools with 4x CPU throttling, tapping the “Size” filter produced an interaction of about 520 ms. The breakdown looked like this: 180 ms of input delay because a recommendation widget was still running its start-up script, 260 ms of processing because the handler re-sorted and re-rendered all 240 product cards, and 80 ms of presentation delay. Three different problems, three different fixes. Moving the widget behind a user action, rendering only the first 24 cards and yielding after the filter state changed brought the same tap down to roughly 150 ms in the same lab setup. Your numbers will differ, but the method of measuring the phases first carries over to almost any site.
How to improve INP score: 10 fixes in priority order
The fixes below start with the ones that most often make the biggest difference for the least effort. You will not need all ten. Use the phase breakdown from the previous section to decide where to begin.
1. Break up long tasks on the main thread
A long task is any piece of JavaScript that runs for more than 50 ms without a break. While it runs, the browser cannot respond to a tap, so input delay grows. The fix is to split the work into smaller pieces and give the browser a chance to handle input between them, which is called yielding. Google’s guide to optimizing long tasks covers the techniques in depth.
function yieldToMain() {
  if (globalThis.scheduler && scheduler.yield) {
    return scheduler.yield();
  }
  return new Promise(resolve => setTimeout(resolve, 0));
}

async function processItems(items) {
  for (const item of items) {
    renderItem(item);
    await yieldToMain();
  }
}
scheduler.yield() is supported in Chromium-based browsers and resumes your work ahead of other queued tasks. The setTimeout fallback works everywhere. Yielding after every single item can slow the total work down, so in real code you might yield every 50 ms or every 20 items instead.
2. Audit and defer third-party scripts
Chat widgets, A/B testing tools, ad scripts, heatmaps and tag managers all run on the same main thread as your own code. When they start up or fire timers, every tap has to wait. In our audits, third-party code is the most common source of input delay on marketing sites and blogs.
- List every external script on the page and note what it is for. You will usually find at least one that nobody uses anymore.
- Load the rest with
deferorasync, or only after the first user interaction. A chat widget does not need to start before someone has scrolled. - Replace heavy embeds, such as video players and social feeds, with a lightweight placeholder that loads the real thing on click.
- In your tag manager, check how many tags fire on every page view and on every click. Click-triggered tags run inside the very interaction INP is measuring.
3. Do less work inside event handlers
The code that runs when someone taps should do only what is needed to show a visible response. Everything else can wait for the next frame or the next idle moment. The trick is to update the interface first and defer the rest:
button.addEventListener('click', async () => {
  showSelectedState(button);   // visible feedback first
  await yieldToMain();          // let the browser paint
  sendAnalyticsEvent('filter');
  saveFilterToStorage();
});
Analytics events, writing to local storage, prefetching the next page and syncing state with a server are all things visitors do not see. Moving them after the paint often removes a large share of processing time without changing any feature.
4. Debounce input on search boxes and filters
A search field that filters results on every keystroke runs its handler ten times while someone types a ten-letter word. If each run takes 40 ms, the field feels sticky. Debouncing waits until typing pauses, usually 150 to 300 ms, before running the expensive part. Keep the letter appearing in the field instant, and debounce only the filtering and rendering of results.
This was one of the first suspects on our own site. Our tools directory has a client-side search box that filters every tool as you type, and it is exactly the kind of interaction that INP punishes on slower phones.
5. Keep the DOM small
Every element on the page adds to the work the browser does when it recalculates styles and layout after an interaction. Lighthouse warns at around 800 elements and flags pages above roughly 1,400. Pages with 5,000 or more elements, which are common on category pages and long FAQ pages, often have long presentation delays no matter how efficient the JavaScript is.
- Paginate or lazy-render long lists instead of putting every item in the HTML.
- Remove hidden duplicates, such as a separate mobile and desktop menu that both exist in the DOM.
- Flatten deeply nested wrappers left over from page builders.
If you paginate, do it in a way search engines can still crawl. Our guide to pagination SEO shows how.
6. Use content-visibility for long, off-screen sections
The CSS property content-visibility: auto tells the browser to skip layout and painting for sections that are not on screen. On a long page, that can make every style recalculation cheaper, which shortens presentation delay. Pair it with contain-intrinsic-size so the page does not jump when sections render:
.product-reviews,
.site-footer {
  content-visibility: auto;
  contain-intrinsic-size: auto 600px;
}
Test the result. A poorly chosen placeholder size can cause layout shifts, which would trade an INP problem for a CLS problem.
7. Avoid forced layouts and layout thrashing
When JavaScript changes a style and then immediately reads a layout property such as offsetHeight or getBoundingClientRect(), the browser has to calculate the layout right away instead of waiting for the next frame. Doing that inside a loop, which is called layout thrashing, can turn a 10 ms handler into a 200 ms one. Read all the values you need first, then write all the changes. For visual updates, schedule the writes with requestAnimationFrame.
8. Ship less JavaScript
Every kilobyte of JavaScript has to be downloaded, parsed and compiled, and much of it runs on the main thread during the first seconds of a visit, which is exactly when visitors start tapping. Practical ways to cut it:
- Split bundles by route so a blog post does not load the checkout code.
- Remove polyfills for browsers you no longer support.
- Replace large libraries with smaller ones or with native browser features, for example native
<dialog>and<details>instead of a modal library. - On WordPress, check which plugins add scripts to every page, including pages where they do nothing.
If your pages rely on JavaScript to show their main content, the JavaScript Rendering Checker shows how much of the page exists only after scripts run. Heavy client-side rendering tends to hurt INP and crawlability at the same time, which our JavaScript SEO guide covers in more detail.
9. Move heavy work off the main thread
Some work is expensive no matter how you slice it: parsing a large JSON file, sorting thousands of records, image processing or complex calculations. Web Workers run JavaScript on a separate thread, so the main thread stays free to respond to taps. The handler posts a message to the worker, shows a loading state, and updates the page when the worker replies. For many filtering and search features, this removes processing time from the interaction almost entirely.
10. Give instant visual feedback
INP ends at the next paint, not when all the work is done. If an action truly needs time, such as loading results from a server, show a response right away: a pressed button state, a spinner or a skeleton of the results. The interaction is then measured up to that first visible change. This is not a trick to hide a slow site. It is how good interfaces have always worked, and visitors notice the difference.
INP fixes by platform
The same principles apply everywhere, but the usual culprit changes with the stack.
| Platform | Most common cause | First thing to try |
|---|---|---|
| WordPress | Plugins and page builders adding scripts and deep DOM trees to every page | Disable unused plugins, delay non-essential scripts until interaction, simplify builder layouts |
| Shopify | Apps injecting scripts into the theme, heavy product filters | Remove unused apps and their leftover code, render fewer products per page |
| React, Vue or Next.js apps | Large re-renders after state changes, hydration at start-up | Memoize expensive components, split state, use transitions for non-urgent updates |
| News and content sites | Ad scripts, consent banners and analytics tags | Audit tags, lazy-load ad slots, load the consent tool as early and as lightly as possible |
What we learned when our own INP went over 200 ms
We track our own Core Web Vitals in the same way this guide recommends, and we use mobile INP as a quality gate before publishing new batches of pages. In the week from 6 to 13 November 2026, the origin-level mobile INP for seomods.com rose from 151 ms to 202 ms in the Chrome UX Report. Desktop stayed at 29 ms. That is a small move, but it crossed the 200 ms threshold, so our own release checks stopped further deployments until we understood it.
Three lessons from that episode apply to almost any site:
- Desktop numbers hide mobile problems. A 29 ms desktop INP next to a 202 ms mobile INP means the code is not inherently slow. It is too slow for mid-range phones. Always look at mobile first.
- New pages inherit the origin value. Pages without enough traffic for their own data are judged on the whole site’s numbers. One slow template can drag every new page with it.
- Start with what changed. The first suspects were features added shortly before the rise: a new third-party script and the client-side search box on our tools directory. Comparing the timeline of releases with the weekly field data narrows the search faster than profiling the entire site.
The 28-day window also means the field value lags any fix by weeks. We note the release date of each change so that we can match it to the weekly trend later, rather than guessing which fix did what.
Does INP affect SEO rankings?
Yes, but modestly. Core Web Vitals are part of the page experience signals Google uses, and Google has said that good scores support ranking without guaranteeing it. Relevance and content quality still come first. A page with a poor INP and the best answer to a query can outrank a fast page with a weak answer.
The stronger argument is what INP does to visitors. A filter that freezes for half a second leads to repeated taps, abandoned carts and fewer pages per visit. Those effects are visible in your analytics long before they show up as a ranking change. Treat INP as a usability problem first and an SEO signal second, and you will prioritize the right fixes. For the bigger picture of how INP fits next to loading speed and layout stability, see our Core Web Vitals guide and the wider page speed optimization checklist.
Common INP mistakes to avoid
- Testing only on a fast laptop. Without CPU throttling, almost every interaction looks fine. Your visitors’ phones are slower than your development machine.
- Chasing the Lighthouse performance score. Lighthouse does not measure INP. A score of 100 can sit next to a failing field INP if the slow interactions happen after load.
- Fixing the loading phase only. Image compression and caching help LCP, but they rarely change INP. Responsiveness is a JavaScript and rendering problem.
- Expecting instant results. The 28-day field window means improvements appear gradually. Use your own monitoring, such as the web-vitals library, to confirm a fix within days.
- Adding a script to measure performance that slows the page down. Some monitoring tools are heavy themselves. Measure their cost as you would any other third-party script.
Frequently asked questions
What is a good INP score?
A good INP is 200 milliseconds or less at the 75th percentile of real visits. Between 200 and 500 ms needs improvement, and anything above 500 ms is poor. Mobile and desktop are assessed separately, so you can pass on one and fail on the other.
Why is my INP poor on mobile but good on desktop?
Phones have slower processors than desktops, so the same JavaScript takes several times longer to run. Long tasks that finish in 30 ms on a laptop can take 150 ms or more on a mid-range Android phone. Profile with CPU throttling to see the mobile picture.
How do I find which interaction is causing poor INP?
Use the web-vitals library with attribution to log the element, the event type and the phase timings of slow interactions from real visitors. In the lab, record a trace in Chrome DevTools while you click through menus, filters and forms with CPU throttling enabled.
Can a page have a perfect Lighthouse score and a poor INP?
Yes. Lighthouse measures a page load without real interactions, so it cannot see a slow filter or menu. Its Total Blocking Time hints at input delay during load, but only field data shows the true INP.
How long does it take for INP improvements to show?
Chrome UX Report data covers a rolling 28-day period, so a fix appears gradually and is fully reflected after about four weeks. Search Console may take a little longer to update its Core Web Vitals report and validation.
Do third-party scripts affect INP?
Very often. Chat widgets, ads, tag managers and testing tools run on the main thread and delay your own handlers. Removing unused tags and loading the rest after interaction is one of the quickest ways to cut input delay.
Is INP a ranking factor?
INP is one of the Core Web Vitals that Google uses as part of its page experience signals. Its effect on rankings is modest compared with relevance and content quality, but it has a direct effect on how visitors use your site.
What replaced First Input Delay?
Interaction to Next Paint replaced First Input Delay as a Core Web Vital in March 2024. INP covers every interaction during a visit and includes processing and rendering time, while FID measured only the waiting time of the first interaction.
Applying this to your own site? See the tools picked by audience: SEO Tools for WordPress Site Owners and SEO Tools for E-commerce Managers.
Conclusion: measure the phase, then fix the cause
Improving INP is less about general speed tricks and more about finding one slow interaction and asking which of its three phases is to blame. Input delay points to long tasks and third-party scripts. Processing time points to heavy event handlers. Presentation delay points to a large DOM and forced layouts. Fix the phase that is slow, give visitors instant feedback, and check the trend over the following four weeks.
Start now: run your most important page through the Core Web Vitals Checker to see your mobile INP, check its weight with the Page Speed & Size Test, then record one trace of your slowest menu or filter in DevTools. You will usually know which of the ten fixes to apply within the first half hour.
