High Impressions but Low Clicks: How to Fix CTR
High impressions but low clicks? Average position tells you whether it is a ranking problem or a snippet problem — and this guide gives the fix for both.
Read article →Estimate any website’s monthly visits from real public popularity data: likely range, worldwide rank, 30-day trend, visits by country and the authority behind it. Compare up to 10 sites.
Fetching live data…
The Website Traffic Checker is a free tool that estimates how many visits any website gets per month. Enter a domain and you get an estimate with a likely range, the site's worldwide rank, its 30-day trend, an estimated split of visits by country and the link authority behind the traffic. It works for competitors as well as your own site, needs no signup and compares up to 10 sites at once.
No outside tool can see another site's analytics, so every traffic checker estimates. Ours is built on real, public popularity data: Google's Chrome UX Report, which lists the most-visited sites by real Chrome users worldwide and in each country, a daily worldwide ranking of the top one million domains, and, for smaller sites that appear in neither, SeoMods' own link graph of more than 130 million domains. We refresh the lists every week on our own servers and turn ranks into visits with curves calibrated on 49 sites whose real monthly visits are known (large and small, global and Turkish); on those sites half of our estimates land within ×1.7 of the real figure. Every site is measured the same way.
A traffic estimate answers questions that come up all the time: how big is this competitor, really? Is a site that offers a sponsored post worth the price? Which market does a rival get most of its visitors from? Is a niche site you want to buy growing or shrinking? Because every site is measured with the same method, the estimate is at its best when you compare sites side by side and watch trends, rather than treating one number as exact.
We test the method on 49 sites whose real monthly visits are known: half of the estimates land within ×1.7 of the real figure, and the range shown holds the real figure for about two in three of them. For small sites outside the public top-million lists, only the link graph is left, so treat the figure as an order of magnitude. For your own site, Google Analytics and Search Console have the exact numbers.
The public lists only cover roughly the top one million sites worldwide and per country. Below that, a site has too few visits to rank in them, and we fall back to its position in our link graph. A site with no links and no list position is usually getting fewer than a few hundred visits a month.
No. Those tools use their own panels and paid data, and their numbers differ from each other too. Ours is built from public popularity data and our own link graph. Expect the same order of magnitude, not the same figure, and compare sites inside one tool.
No outside tool can see where another site's visitors come from. The split starts from published channel averages for the site's type and size (big news sites live on direct visits, reference sites on search) and is adjusted by what we find on the homepage: an ad-click tag, a social ad pixel, social profile links, a newsletter form and whether robots.txt blocks the AI search crawlers. Your own exact split is in Google Analytics.
The popularity lists are refreshed every week, and the 30-day trend comes from the daily ranking. The date of the data is shown under every result.
Guides, tips and tutorials hand-picked for this tool — go from running a check to actually fixing it.
 Analytics
High impressions but low clicks? Average position tells you whether it is a ranking problem or a snippet problem — and this guide gives the fix for both.
Read article →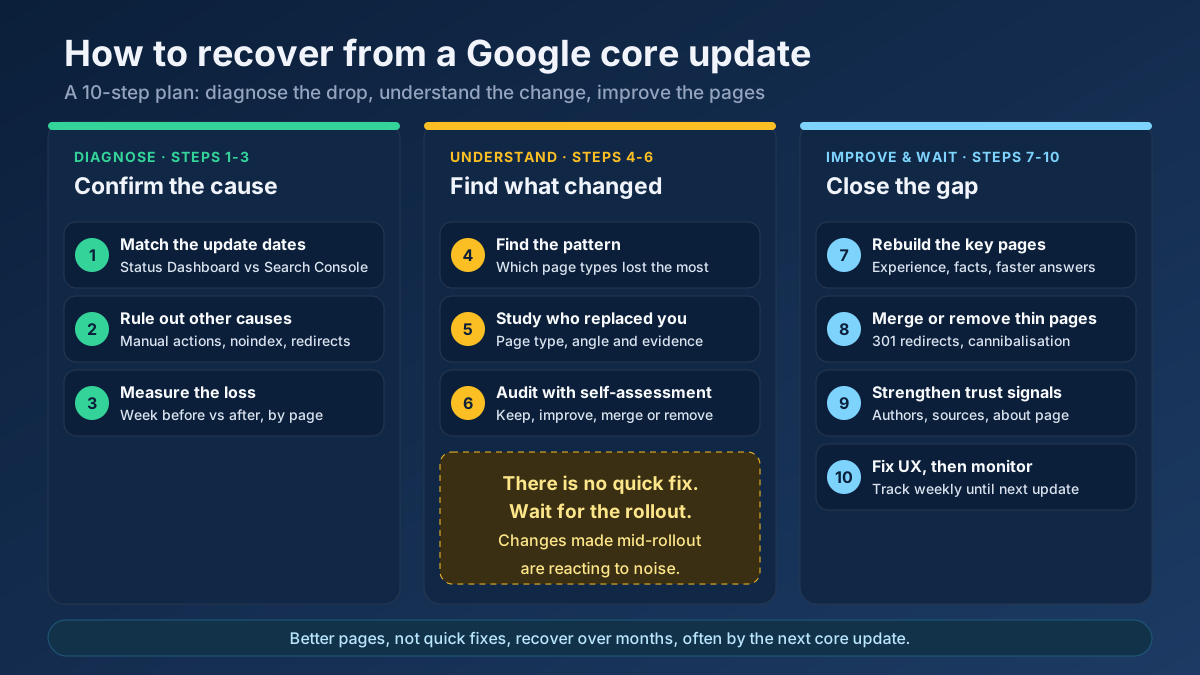 Analytics
Learn how to recover from a Google core update: confirm the drop, rule out technical issues, find the pages that lost and rebuild them in 10 clear steps.
Read article →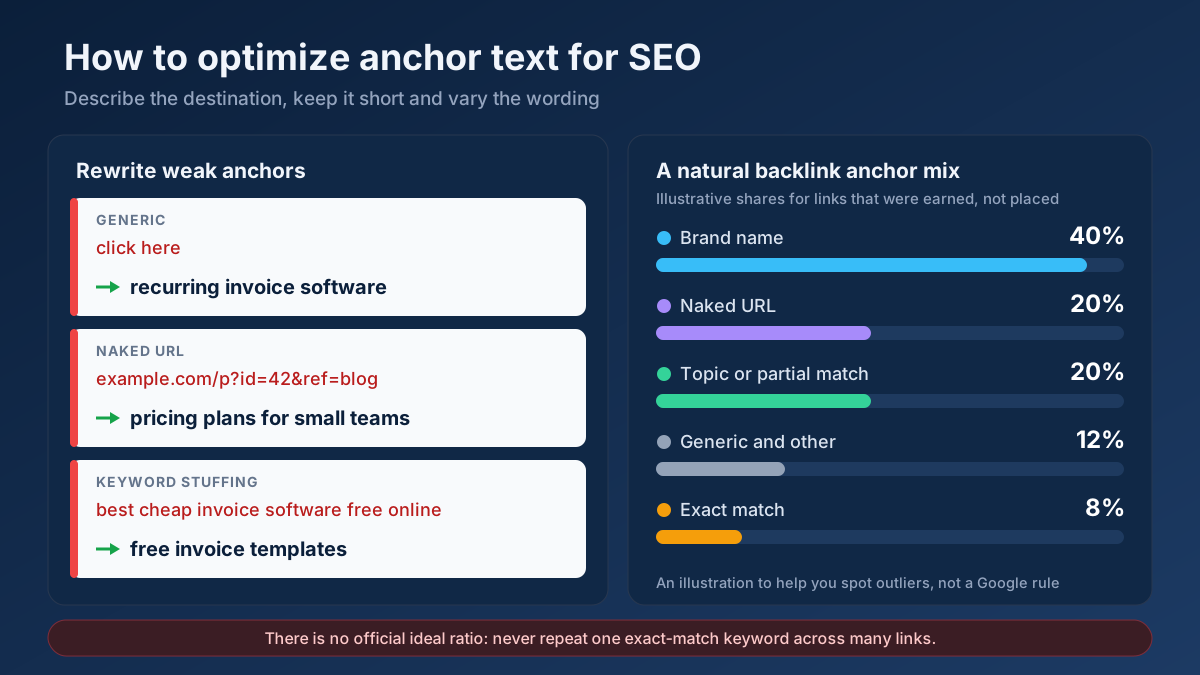 Link Building
How to optimize anchor text for SEO in 9 steps: anchor types, internal link and backlink rules, a natural ratio, rewrite examples and mistakes to avoid.
Read article →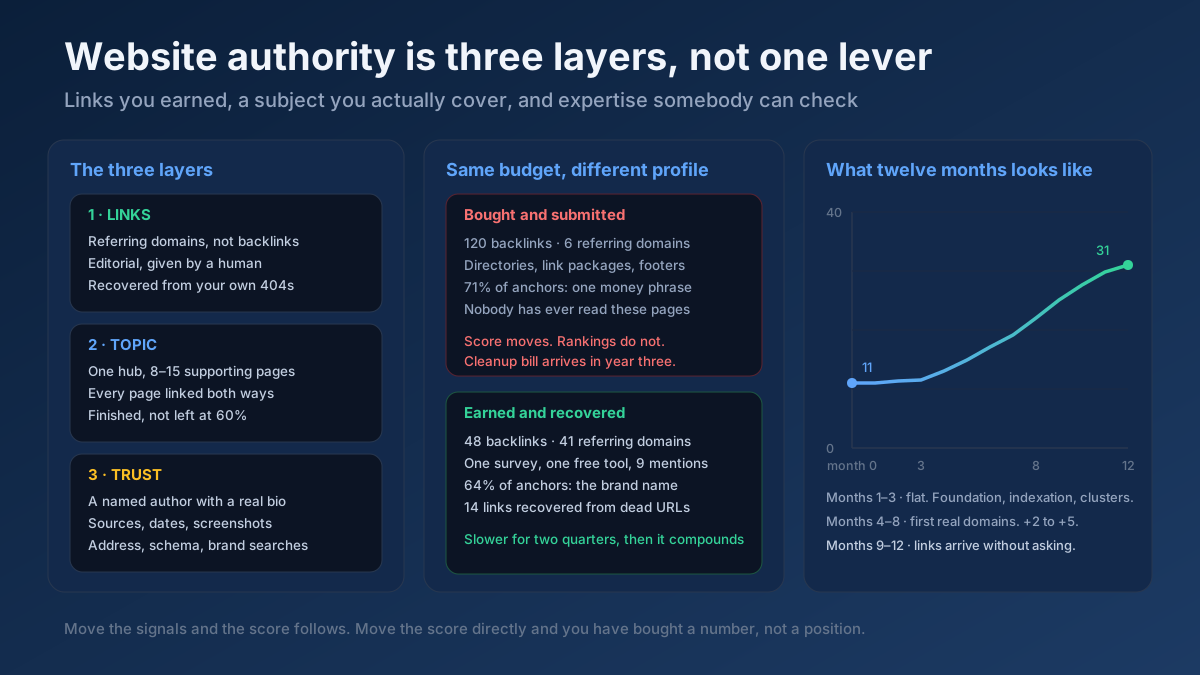 Link Building
How to increase website authority in 10 steps: what the score really measures, the link and content work that moves it, and how long each stage takes.
Read article →Spammy links can drag your site down. Here is how to identify and disavow them safely.
Read article → Analytics
Organic traffic drops for seven reasons. Read the shape of the drop, segment it in Search Console, and follow the recovery playbook for your actual cause.
Read article →Estimate where a domain ranks for a keyword by analyzing on-page relevance signals against the target term.
Open tool →Check the Domain Rating (DR) of any website from our own link index: referring domains, their strength, the strongest linkers, follow/nofollow mix and how many links the next DR level takes. Compare up to 10 sites.
Open tool → EstimateMap a niche: aggregate real keyword demand signals and competitor angles to size up a market.
Open tool →Check real Domain Authority (DA) and Page Authority (PA) for any website, built on real link-graph authority data. See the raw authority index and global rank, and compare up to 20 domains at once — free, with no signup.
Open tool →Full technology & SEO profile of any website (Wappalyzer + BuiltWith style): CMS, theme, plugins, framework, JS & CSS libraries, CDN, hosting, analytics, tag managers, ads, fonts, cookie tools, schema, Open Graph, security headers, HTTP version, SSL, WHOIS, DNS, IP, country and on-site SEO signals.
Open tool →Compare outbound link profiles of two competitor pages to find linking domains you could also target.
Open tool →